Company Notes Series (#4): engcon

Editor’s note: This is the latest edition in the “Company Notes Series”, where we periodically share our notes on companies we’ve studied in the recent past but currently have no vested interest in (we may invest in or sell shares in the companies mentioned at any time). The notes are raw and not updated, and the “as of” date for the data is given at the start of the notes. The first three editions in the series can be found here, here, and here. Please give us your thoughts on the series through the “Contact Us” page; your feedback will determine if we continue with it. Thanks in advance!

Start of notes for engcon

Data as of 31 December 2023

Background

  • Year founded: 1990
  • Listed in Stockholm Stock Exchange (Sweden) since 17 June 2022
  • Headquarters: Stromsund, Sweden

Business

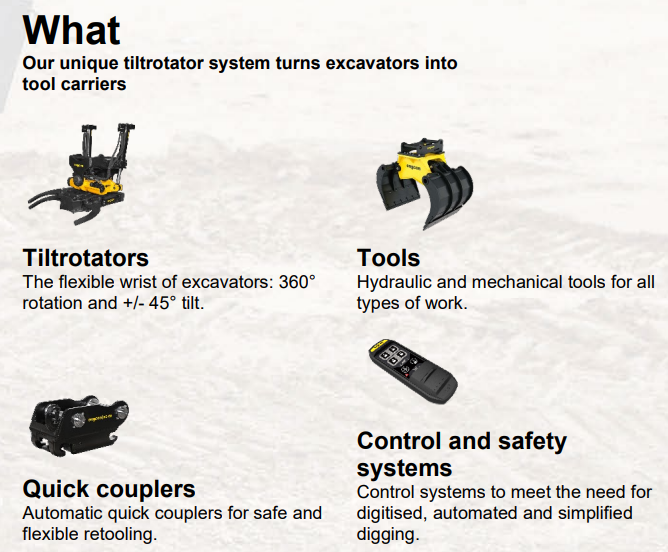
  • engcon manufactures tiltrotator systems that turns excavators into tool carriers (see Figure 1). The hydraulic tools provided by the company include detachable grippers, stone and sorting grabs, combi grabs, and more. See engcon’s Youtube video for more.
Figure 1
  • engcon’s tiltrotator solutions are developed, manufactured and subsequently fitted on new or existing excavators. Dealers serve as a link between excavator manufacturers (OEMs, or original equipment manufacturers), tiltrotator manufacturers, and end-customers. End-customers are contractors, companies that own excavators, and excavator rental companies. engcon has partnerships with OEMs that increase the reach of the company’s products and prepare excavators for faster and easier installations of tiltrotators; the partnerships also provide valuable insight into which technologies OEMs are developing for the future, and engcon contributes with knowledge of end-customer requirements.  
  • engcon’s tiltrotator solutions are focused on excavators in the weight class of 2 tonnes to 33 tonnes.
  • The production of engcon’s tiltrotator solutions happens in the company’s production sites in Strömsund, Sweden and Niepruszewo, Poland. engcon’s tiltrotator solutions consist of various components designed by the company. Some of the components are also manufactured at engcon’s aforementioned production sites but most of the components are purchased from suppliers in Sweden and Northern Europe. 
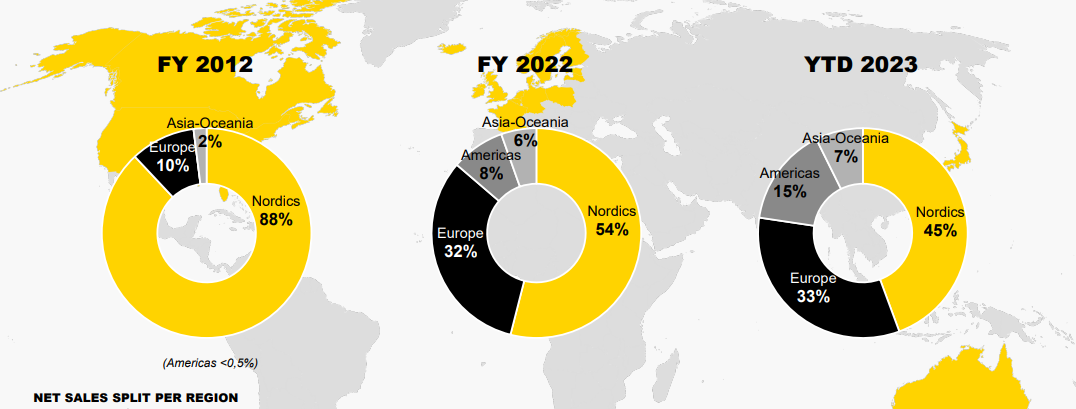
  • engcon had sales in 16 markets across the globe in 2022 and its sales split by geographic region in 2022 and 9M 2023 is shown in Figure 2 below. The years in which engcon entered its various markets are:
    • Sweden: 1990
    • Finland and Norway: 1995
    • Denmark and Germany: 2003
    • UK: 2004
    • France: 2014
    • Netherlands: 2016
    • USA: 2017
    • Japan: 2018
    • South Korea and Australia: 2020
    • Canada, Belgium, Ireland, and Austria: 2021-2022
Figure 2
  • The majority of engcon’s sales take place through a global network of dealers. Sales also take place through collaboration with OEM dealer networks. A limited amount of products, mainly buckets and tools, are sold through engcon’s website in Sweden, Finland and Denmark. 
  • No single customer accounted for >10% of engcon’s sales in 2022, so there’s no customer concentration. But there may be supplier concentration for engcon: 10 of engcon’s largest suppliers in 2021 accounted for 58% of the company’s total purchases of raw materials and components.
  • A tiltrotator had an average price (including engcon and competitors) of SEK 176,000 (around US$19,000) in 2021. Dealers typically earn 30% of the price of a tiltrotator.
  • engcon released its 3rd-gen tiltrotator solution in May 2022. The 3rd-gen system is equipped with technology that has never been used on tiltrotators and that takes a clear step towards the electrified, connected and autonomous excavators of the future. The 3rd-gen’s load-sensing technology leads to reduced fuel consumption, improved precision, less wear and tear, and lower maintenance costs. The reduced energy need simplifies the use of alternative fuels for excavators, such as electricity and hybrid solutions. With help from a new sensor technology, the newly developed control system can precisely calculate the tilt and rotation of the tiltrotator, which means improved user-friendliness and greater potential for autonomous operations. Furthermore, the newly developed control system enables a more efficient remote connection, thereby improving remote support as well as the ability to remotely configure equipment.

Market opportunity

Newly manufactured excavator market for engcon

  • Globally, 665,000 excavators were sold in 2021. Of these 665,000 excavators, a total of 181,775 excavators belonging to the 2-33 tonne weight class (engcon’s focus is on excavators in that weight class) were sold in the Nordics, Europe, Americas, and Asia/Oceania; these regions are engcon’s key geographical markets as shown in Figure 2, and are named as the Focus Markets by the company. In the same year (2021), 12,934 tiltrotators for newly manufactured excavators, and 1,750 tiltrotators for existing excavators, were sold. The value of the tiltrotators sold was SEK 2.6 billion (around US$285 million). 
  • The number of excavators sold in the Focus Markets compounded at 6% per year for 2016-2019. COVID affected the market in 2020, but ultimately, the number of excavators sold in the Focus Markets still compounded at 2% per year for 2016-2021. The historical growth in the excavator market for each of engcon’s Focus Markets:
    • Nordic: 7,206 excavators sold in 2021, CAGR (compound annual growth rate) of 3% for 2016-2019, CAGR of 1% for 2016-2021,
    • Europe: 76,097 excavators sold in 2021, CAGR of 6% for 2016-2019, CAGR of 2% for 2016-2021
    • Americas: 62,972 excavators sold in 2021, CAGR of 10% for 2016-2019, CAGR of 4% for 2016-2021
    • Asia/Oceania: 35,481 excavators sold in 2021, CAGR of 2% for 2016-2019, CAGR of -1% for 2016-2021
  • The number of tiltrotators sold in the Focus Markets had a CAGR of 11% for 2016-2021, including a 15% decline in 2020 because of COVID. The value of tiltrotators sold in the Focus Markets had a CAGR of 15% for 2016-2021.
  • According to PwC, the value of the tiltrotators market is expected to compound at 19% from 2021 to 2026, driven by: (1) greater demand for productivity increases; (2) population growth and urbanisation; (3) lack of labour; (4) sustainability requirements; (5) excavators transitioning to becoming multi-purpose tool carriers and more autonomous; (6) and digitalisation and electrification of the construction market.
  • According to PwC: (1) Excavators equipped with tiltrotators are able to replace 2.2 other construction machines on average; (2) a tiltorator can increase the productivity of an excavator by 25%; (3) the use of a tiltrotator can save 6,000 litres of diesel annually, thus reducing 16,200 kg of CO2 emissions per year; (4) excavators with tiltrotators have a better safety profile as operators can exchange tools from within the cabin. 
  • The penetration rate of tiltrotators in newly manufactured excavators was 2% globally in 2021, 85% in the Nordics (92% in Sweden), and 7% in the Focus Markets. The penetration rate is closely connected to the maturity of the market, which can be divided into 3 phases: Development; acceleration; and mature. In the development phase, the penetration rate increases from 0% to 20%-25%. In the acceleration phase, the penetration rate has passed 20% and risen to 60%. The tipping point between the development phase and the acceleration phase is where the tiltrotator takes the step to becoming an established market standard. Authorities and clients, such as major construction and civil engineering companies, places requirements on excavators to be equipped with a tiltrotator for efficiency and safety reasons. Once the tipping point has been reached, the sales of tiltrotators to both new excavators and the aftermarket tends to gain momentum.
  • The market for tiltrotator manufacturers has 5 major operators (see Figure 3) that account for 95% of sales. engcon is the largest, with a market share of 45%. Tiltrotator manufacturers can be divided into 4 groups: global manufacturers, local manufacturers, other operators whose core operations are not tiltrotators, and excavator manufacturers (OEMs) with in-house manufactured tiltrotators. The 5 largest tiltrotator manufacturers are all global manufacturers, 4 of which are Swedish. All 5 collaborate with OEMs and the product portfolio includes quick couplers, tools, and other advanced attachments for excavators. engcon’s market share has increased from 42% in 2019 and 43% in 2020.
Figure 3

Existing excavator market for engcon

  • Number of newly-manufactured excavators in engcon’s Focus Markets that will not be equipped with tiltrotators for 2022-2026 is expected to be 960,000. This provides a large pool of retrofitting potential for engcon.

Management and major shareholders

  • engcon has Class A and Class B shares. Class A shares carry 10 votes per share while Class B shares have 1 vote per share. The Class B shares are public-listed. At end-2022, engcon had a total sharecount of 151.788 million (35.34 million Class A shares, 116.44 million Class B shares.
  • Stig Engstrom, 62, is the founder of engcon. He handed over the CEO role to Orjan Westerlund in 2003, and has been on the board of engcon since. Stig Engstrom controlled 29.04 million Class A shares and 24.74 million Class B shares at end-2022, which amounted to 35.4% of engcon’s total share count, but 67.1% of the total votes.
  • Stig Engstrom’s ex-wife, Monica Engstrom, has been on engcon’s board since 2004. Monica Engstrom controlled 6.31 million Class A shares and 42.21 million Class B shares at end-2022, which amounted to 32.0% of engcon’s total share count, but 22.4% of the total votes.
  • engcon’s CEO is Krister Blomgren, 58, who has been in the role since 2011. Blomgren controlled 1.259 million engcon Class B shares as of end-2022, which is 0.8% of the total share count. 
  • Other members of engcon’s management team are shown in Table 1 below (some of them have long tenures, which is good):
Table 1
  • Remuneration of Stig Engstrom and Krister Blomgren for 2019-2022 is shown in Table 2 below. Not much details are given on how they are compensated beyond the total amounts. The big jump in compensation for Blomgren in 2022 bears watching, but is only a tiny percentage of engcon’s profit and cash flow during the year.
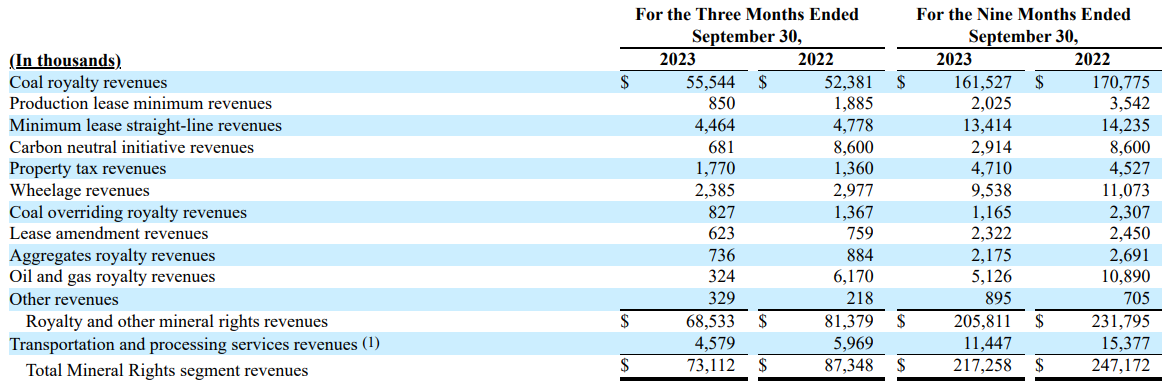
Table 2

Financials

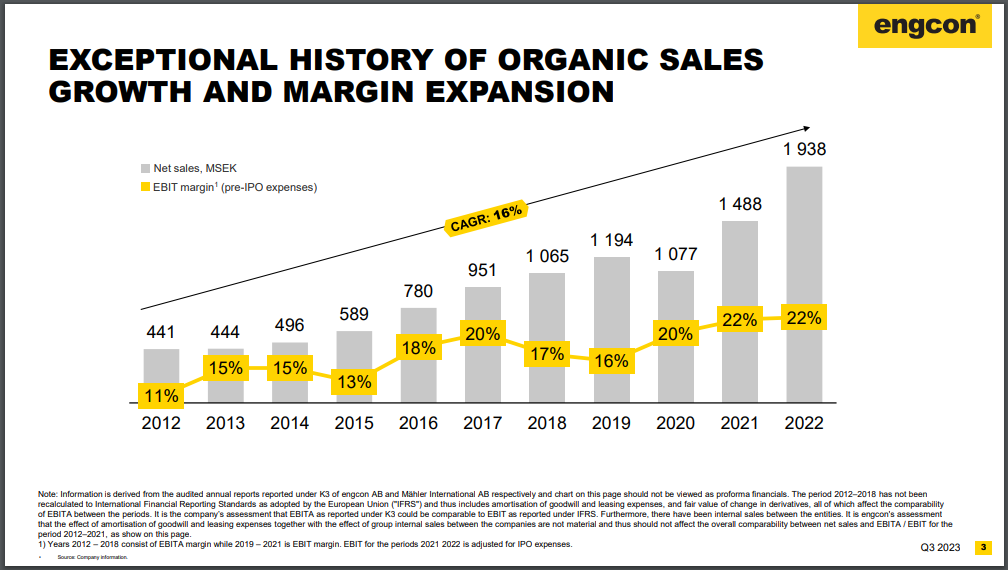
  • engcon’s revenue has CAGR of 16% from 2012 to 2022, and EBIT margin has doubled from 11% to 2022% in that period. See Figure 4
Figure 4
Table 3
  • From Table 3 above, engcon’s revenue CAGR for 2019 to 12 months ended 30 Sep 2023 is 16.7%. Net income CAGR is 25.6%, and FCF CAGR is 44.8%. Average net income margin is 15.9%, and average FCF margin is 14.0%.
  • engcon saw a large pull-forward of orders in 2021 Q4 and 2022 Q1, mainly in Nordic and Europe, due to price increases and uncertainty concerning delivery times, combined with an uncertain business environment and long lead times. So engcon expects 2023’s overall revenue growth to be just 8% (2023 Q1 growth was 55%, 2023 Q2 was -5%, and 2023 Q3 was -6%). Operating income also fell sharply in 2023 Q2 (12%) and 2023 Q3 (51%)

Valuation

  • Stock price on 31 December 2023: SEK 93.30
  • Trailing EPS = 2.33; Trailing PE = 40
  • Trailing FCF per share = 2.80; trailing PFCF = 33
  • For a company that is very likely going to post a further year-on-year decline in net income and FCF in 2023 Q4, those valuations look high.

Risks

  • engcon protects its business via patents, of which the most important relates to EC-Oil, which is a quick coupler system that allows for the replacement of hydraulic tools from the excavator’s cabin without the mounting of hoses and electrical cables. The patent, which has a maximum validity up to and including 2024, is not assessed to be business-critical, but it still helps to distinguish engcon’s tiltrotator systems and make it more difficult for competitors to copy. When the patent for EC-Oil expires, it may be difficult for engcon to have a distinctive product offering. 
  • The sale of excavators globally has been stronger than what I expected before researching engcon. But the overall construction market – including the sale of excavators – is probably sensitive to recessions. So future recessions are a risk.
  • There’s the possibility that someone comes up with a superior tiltrotator or similar solution to what engcon has.
  • In the shorter term, engcon has clearly been over-earning in 2021 and 2022, and is now suffering the hangover in 2023. Will the hangover last a long time? That’s a possibility, despite tiltrotators being a superior solution. 
  • In June 2022, Rototilt Group filed a lawsuit against engcon that alleged that the company had infringed upon a patent. The adjusted damages claimed amounted to approximately SEK 200 million. The alleged infringement relates to sensor technology in the Q-safe locking system. In May 2023, the Swedish Patent and Market Court announced its verdict regarding Rototilt’s lawsuit against engcon. The court determined that no infringement had taken place and therefore dismissed Rototilt’s action. The court determined that no infringement had taken place and therefore dismissed Rototilt’s action. At the same hearing, engcon claimed that Rototilt’s patent should be declared invalid. However, the court determined that the patent was valid. Following appeals, both parties were granted leave to appeal by the Swedish Patent and Market Court. A ruling in the higher court is expected in spring 2024 at the earliest.

Disclaimer: The Good Investors is the personal investing blog of two simple guys who are passionate about educating Singaporeans about stock market investing. By using this Site, you specifically agree that none of the information provided constitutes financial, investment, or other professional advice. It is only intended to provide education. Speak with a professional before making important decisions about your money, your professional life, or even your personal life. We currently have no vested interest in any company mentioned. Holdings are subject to change at any time.

Company Notes Series (#3): Golden Throat Holdings Group Company

Editor’s note: This is the latest edition in the “Company Notes Series”, where we periodically share our notes on companies we’ve studied in the recent past but currently have no vested interest in (we may invest in or sell shares in the companies mentioned at any time). The notes are raw and not updated, and the “as of” date for the data is given at the start of the notes. The first two editions in the series can be found here and here. Please give us your thoughts on the series through the “Contact Us” page; your feedback will determine if we continue with it. Thanks in advance!

Start of notes for Golden Throat Holdings

Data as of 16 January 2023

History of Golden Throat Holdings and current management/major shareholders

  • Current HQ: Guangxi Zhuang, China
  • IPO date: July 2015, on Hong Kong Stock Exchange
  • Golden Throat Holdings’ history dates back to 1956 when Liuzhou No.2 Sweet Factory (柳州市糖 果二廠), the predecessor of Golden Throat Company (also known as Guangxi Golden Throat), was established. Golden Throat Company today manufactures and sells lozenges and other pharmaceutical and food products.
  • Golden Throat Holdings’ flagship product is Golden Throat Lozenges (OTC), which was launched in 1994. Wang Yao Fa contributed to the creation of the formula for the Golden Throat Lozenges (OTC) product and his portrait was historically used by Golden Throat Holdings on the product packaging; the portrait was changed to Jiang Peizhen in 2015.
  • Golden Throat Company (the main operating entity in China of Golden Throat Holdings) was established in Liuzhou, Guangxi Zhuang, China, on 18 September 1998 by Jiang Peizhen as the original controlling shareholder. She has been involved with Golden Throat Holdings for over 60 years, since 1956.
  • Jiang and her son, Zeng Yong, control 69.79% of Golden Throat’s shares (the 69.79% equates to 516.0137 million shares) as of 30 June 2022. At the 11 January 2023 share price of HK$1.98, their stake equates to HK$1.02 billion.
  • Jiang, 76, is currently chairman and non-executive director of Golden Throat Holdings, while Zeng, 48, is an executive director and vice chairman of the board. Zeng has been involved with Golden Throat Holdings since 1995. Both Jiang and Zeng have been in their respective roles since February 2015.

Golden Throat Holdings’ business

  • Revenue in 2021 was RMB 820.5 million, of which 99.6% was from Mainland China.
  • The company reports its revenue by three product categories, which include Golden Throat Lozenges (OTC), Golden Throat Lozenge Series Products, and other products.
  • Golden Throat Lozenge (OTC): A type of lozenge mainly designed to relieve symptoms of sore and dry throat and hoarse voice caused by acute pharyngitis. Golden Throat Lozenges (OTC) was approved as over-the-counter medicine by the National Medical Products Administration (NMPA), China’s version of the FDA in the USA. As such, Golden Throat Lozenges (OTC) can be purchased by the public in pharmacies without requiring the prescription of a qualified medical professional. As of 31 December 2021, Golden Throat Lozenges (OTC) were exported to the United States, Canada, Russia, the European Union, Australia, Southeast Asia, Middle East, Mexico and Africa, and Mongolia, a newly explored export country in 2019. For the year ended 31 December 2021, Golden Throat Lozenges (OTC) accounted for 90.1% of Golden Throat Holdings’ total revenue.
  • Golden Throat Lozenge Series Products: Includes seven products comprising of Dule Lozenges (都樂含片), sugar-free Dule Lozenges, and five other sugar-free flavours of this series, namely orange (香橙), fructus momordicae (羅漢果), chrysanthemum (桑菊), American ginseng (西洋參) and hawthorn (山楂). A major difference between Golden Throat Lozenges (OTC) and Golden Throat Lozenge Series Products is that the former is approved as over-the-counter medicine, whereas the latter is approved as food products. The sugar-free series of Golden Throat Lozenge Series Products was launched in 2013, which supplements the company’s original sales channel and provides consumers with more diversified choices. As of 31 December 2021, Golden Throat Lozenge Series Products were exported to 17 countries and regions, and accounted for 8.7% of Golden Throat Holdings’ total revenue in 2021.
  • Other products: Accounted for approximately 1.2% of Golden Throat Holdings’ total revenue in 2021. Includes: (1) Yinxingye Tablet ( 銀杏葉片), which is designed to facilitate blood circulation, remove blood stasis and dredge energy channels and was approved as a prescription medicine by the NMPA; (2) a new product, Golden Throat Intestinal Series (金嗓子腸寶), which is an exclusive nutrition for probiotics, also known as prebiotics; and (3) Golden Throat Compound Probiotic Lozenges, which was launched in June 2022 and was developed by Golden Throat Holdings and the scientific research team of “Food Microbial Function Development” of Beijing Agricultural College. Golden Throat Compound Probiotic Lozenges addresses the lack of self-developed probiotics in China. Golden Throat Holdings has developed six kinds of proprietary probiotic bacteria in three new flavors and the company is committed to using “Chinese bacteria” to improve the physique of Chinese citizens. Golden Throat Compound Probiotics adopts the internationally leading three-layer embedding technology, 360-degree thermal radiation freeze drying technology, and automatic ingredient fermentation and cultivation system.
  • Golden Throat Holdings has established an extensive and structured sales and distribution network throughout China for its (i) over-the-counter medicines, (ii) food products, and (iii) prescription medicines. As of 31 December 2021 and 30 June 2022, substantially all of the company’s revenue was generated from sales to distributors. In 2021, there was only one customer that accounted for more than 10% of Golden Throat Holdings’ revenue (11.7%); there was no such customer in 2020.
  • Golden Throat Holdings has a well-established brand in China: 
    • In October 2021, in the 2021 ranking of China nonprescription medicines enterprises and product brands, Golden Throat Lozenges (OTC) was recognised as No. 1 amongst Chinese traditional medicines (Throat) by the China Nonprescription Medicines Association.
    • Golden Throat Holdings was ranked 43rd amongst the nonprescription manufacturing enterprises in the 2021 ranking of China non-prescription medicines enterprises and product brands.
    • Golden Throat Holdings was listed in the Top 500 Chinese Brands at the 14th China Brand Festival in August 2020.
    • In August 2020, Golden Throat Holdings claimed the title of “2019 China Traditional Medicines Pharmaceutical Industry Top 100 Enterprise” at the China Pharmaceutical Industry Top 100 Annual Assembly.
    • In 2019, Golden Throat was awarded the Best Brand Value Award at the China Financial Market Awards 2019, and won the Huapu Award at the 13th China Brand Festival in August.
    •  In 2017, the Golden Throat (金嗓子) brand was selected as a world famous brand by the China America Branding Strategy Forum and also ranked amongst the listed companies on the Forbes China Up-and-Comers List.

Golden Throat Holdings’ market and future expansion

  • According to a 2015 Euromonitor Report, retail sales value of lozenges in China increased 10.4% per year from RMB 2.09 billion in 2009 to RMB 3.42 billion in 2014, and was expected to increase to RMB 5.46 billion in 2019, at a CAGR of 9.7%. Lozenges accounted for 72% of the total throat remedies market in China in 2014; the throat remedies market primarily includes over-the-counter medicines and medicated confectionery (which are food).
  • In 2021, plants and office buildings of a new medicine production and research and development base for Golden Throat Holdings, located at Luowei Industrial Concentration Area, Liuzhou, Guangxi Zhuang Autonomous Region, as well as the commissioning of product lines and trial production were completed. Golden Throat Holdings completed the overall relocation in the second half of 2021. The new production base covers a usable area of about 60,000 square metres, including research and development centres, production plants, warehouses and administrative office buildings. “The fully automated production line in the production plant will improve the efficiency of the production process. A brand-new modern production enterprise will be formed with the new production and research and development base, new factories, new workflow and new production lines, which will completely upgrade the management platform and manufacturing platform of the factories, comprehensively improving the manufacturing quality and technology content of the products, enhancing the comprehensive competitiveness of the Company, and will lay a solid foundation for expanding and strengthening the Company.The new production base increased Golden Throat’s production capacity for its main products by 57% to 198.5 million boxes of Golden Throat Lozenges. See video of the new production base: https://news.gxtv.cn/article/detail_567c4b49e6924346917643b221fe9555.html
  • Also in 2021, Golden Throat Holdings selected a 48 mu (~32,000 square metres) piece of land in the south of the new drug production and R&D base as the site for the second phase of the new Golden Throat Base, which is expected to have a usable area of approximately 50,000 square metres after completion. The second phase will house a food production plant and a food research and development centre. After completion, a high-tech R&D team, smart manufacturing and smart sales will be introduced to develop more comprehensive health products. The second phase of the Golden Throat new base will form the core of Golden Throat Doctor Workstation, the Golden Throat Professor Workstation, the Golden Throat Research Institute, the Golden Throat Gastrointestinal Research Institute, and the Golden Throat Heart and Brain Research Institute. It will also facilitate the development of new products such as genetic medicines, traditional Chinese medicine prescriptions, specialty medical devices, and specialty health foods. As of 30 June 2022, the second phase of the Golden Throat new base is in the initial stage of construction.
  • The Golden Throat WeChat Mini Program Mall was launched in early 2020. “We will continue to expand online sales channel in 2022, and we believe there would be breakthroughs in our online business in the future.”

Golden Throat’s sales volumes and pricing of products

  • There was a change in packaging-configuration in August 2013, so numbers for 2012 and 2013 are not like-for-like comparisons with numbers in later years.
  • Golden Throat Holdings has managed to raise the prices for its Golden Throat Lozenges (OTC) products over time, while keeping  gross margin steady, keeping sales volume steady (although less steady then gross margin), and increasing revenue → signs of pricing power for Golden Throat Lozenges (OTC) product
  • Golden Throat Holdings has managed to raise the prices for its Golden Throat Lozenge Series Products over time, while increasing gross margin, increasing sales volume, and increasing revenue → signs of pricing power for Golden Throat Lozenge Series Products
  • Golden Throat Holdings’ sales volume was hurt in 2020 because of COVID, but the company still maintained or increased its product prices.
  • Golden Throat’s sales volume for Golden Throat Lozenge (OTC) products did not increase much over time because the volume was already near the company’s capacity – prior to the expansion mentioned in Point 3, Golden Throat’s annual production capacity was ~126 million boxes of the Golden Throat Lozenge (OTC) product.

Golden Throat financial performance

Annual numbers

  • Revenue has grown over time but had some ups and downs – same with net profit
  • Was always generating positive operating cash flow and free cash flow (with exception of 2017), although there’s no clear growth in cash flows.
  • Balance sheet was always in a strong net-cash position
  • No history of dilution (IPO happened in 2015 – immediately after IPO, there was around 726.36 million shares)
  • There was a dividend paid in every year since the company’s IPO, and it has increased over time; the dividend also looks fairly sustainable

Half-yearly numbers

  • Revenue growth in H1 2022 was affected by resurgence of COVID in China, and so was net-income
  • But cash flows have improved tremendously and balance sheet remains rock-solid
  • Worth noting that Golden Throat’s borrowings are all on fixed rates, so there’s no danger of rising interesting rates negatively affecting the company’s profit and/or cash flow 

Management’s integrity and kindness

  • There are related party transactions (RPTs), but they are minimal. In 2021, Golden Throat Holdings incurred RMB 9.576 million in expenses to procure raw ingredients (such as liquid isomalt, isomalt AG, syrup, and probiotics) from a related entity, Changbao; in 2020, the amount was RMB 4.388 million. These amounts make up only a single-digit percentage of total net profit (and even much smaller percentage of total revenue) in their respective years.
  • The remuneration of Jiang Peizhen and Zeng Yong has largely increased at a faster rate than Golden Throat Holdings’ revenue, net income, and FCF over the years, especially after the company’s IPO. But their remuneration levels only make up a single-digit percentage of Golden Throat Holdings’ net income (see table below).
  • Golden Throat Holdings ended 2021 with 937 full-time employees, of which 100 are disabled persons. In August 2020, Golden Throat Holdings provided electric vehicles for employees commuting to work. The EVs are produced by Liuzhou SGMW (柳州上汽通用五菱) and Golden Throat Holdings ordered over 700 of them from SGMW. Management thinks the EVs “would not only solve the transportation problem of employees with long commuting distance, but also effectively stimulate domestic demand and help economic growth and recovery.”

Valuation

  • Valuation numbers based on 11 January 2023 share price of HK$1.98
  • Trailing PE (price-to-earnings) of 7.8, trailing PFCF (price-to-free cash flow) of 7.7
  • Net-cash per share of HK$0.88
  • Trailing PE net of cash of 5.0, trailing PFCF ratio net of cash of 4.9
  • Trailing dividend yield of a massive 9.1%
  • Management wanted to acquire the company in August 2021 at HK$2.80 per share together with Affirma (emerging market private equity firm owned and operated by former senior leadership team of Standard Chartered Private Equity; managed over US$ 3.5 billion in assets at the time of the announcement).I think this price could be seen as a floor on the value of Golden Throat holdings. Golden Throat’s trailing earnings per share and free cash flow per share was RMB 0.30 (~HK$ 0.36 ) and RMB 0.18 (~HK$ 0.21), respectively, based on the company’s financials for the first half of 2021, meaning the acquisition price valued the company at a trailing PE and trailing PFCF ratio of just 7.8 and 13.1. Net of cash, the PE and PFCF ratios would be 5.3 and 8.8

Final thoughts (as of 16 January 2023)

  • Very cheap valuation right now
  • Possibility of much higher revenue in 2023 (compared to 2022 and 2021) as China has reopened and Chinese citizens depend on the Golden Throat Lozenge (OTC) product to soothe their ailments from COVID or otherwise; 2022’s overall numbers may be lower than in 2021 as China was in lockdown mode for most of 2022 and only opened up late in the year.
  • Selling prices for Golden Throat Lozenge (OTC) products on Tmall are currently easily more than RMB 10 per box, and more commonly around RMB 12-14 per box (see screenshots below, taken on 16 Jan 2023 from Tmall app – sidenote: Tmall has better reputation than Taobao). The unit sale price to distributors reported by the company in H1 2022 was just RMB 7.0 per box; I think it’s reasonable to expect the unit sale price to distributors for 2023 – as well as overall volume – to be materially higher than 2022 and 2021, thereby boosting profit and cash flow margins for Golden Throat Holdings.
  • Golden Throat Holdings had expanded production capacity in 2021, and is building a new plant right now.
  • Golden Throat Holdings has also received strong government support for the production of its products. See the following English translations of a Mandarin article from the Guangxi government website:
    • On January 4, Wei Guanghui, a member of the party group and deputy director of the Food and Drug Administration of the Autonomous Region, led a team to Guangxi Liangmianzhen Yikang Pharmaceutical Co., Ltd. and Guangxi Golden Throat Pharmaceutical Co., Ltd. The production of Golden Throat Lozenges provides door-to-door service guidance, and pays close attention to ensuring the supply of drugs for the prevention and control of the new crown epidemic.”
    • Golden Throat Lozenges were selected into the “Catalogue of Drugs for New Coronary Virus Infection (First Edition)” issued by the Beijing Municipal Health and Health Commission. In order to meet the clinical needs of the general public, the company has expanded its capacity and production at full capacity, and the Food and Drug Administration of the Autonomous Region has followed up the whole process.”
    • “The working time of Golden Throat Lozenges has been extended from the original 8 hours to 12 hours, and the daily production has increased from 7.37 million tablets to 9.21 million tablets, which strongly supports the anti-epidemic needs of the people across the country.
  • For now, I see Golden Throat Holdings as a deep-value stock, but it could also change into a growth stock if its plans for new products such as genetic medicines, traditional Chinese medicine prescriptions, specialty medical devices, and specialty health foods succeed.
  • One risk to the company’s future business prospects is if its Golden Throat Lozenge (OTC) product price gets controlled by the government. According to the IPO prospectus, “there had been no fixed or maximum prices promulgated by any authorities in China on Golden Throat Lozenges (OTC).” There’s been no update on the matter that I could find in subsequent annual reports.

Disclaimer: The Good Investors is the personal investing blog of two simple guys who are passionate about educating Singaporeans about stock market investing. By using this Site, you specifically agree that none of the information provided constitutes financial, investment, or other professional advice. It is only intended to provide education. Speak with a professional before making important decisions about your money, your professional life, or even your personal life. We currently have no vested interest in any company mentioned. Holdings are subject to change at any time.

Company Notes Series (#2): BayCurrent Consulting

Editor’s note: We’re testing out a new series for the blog, the “Company Notes Series”, where we periodically share our notes on companies we’ve studied in the recent past but currently have no vested interest in (we may invest in or sell shares in the companies mentioned at any time). The notes are raw and not updated, and the “as of” date for the data is given at the start of the notes. The first edition in the series can be found here. Please give us your thoughts on the series through the “Contact Us” page; your feedback will determine if we continue with it. Thanks in advance!


Start of notes for BayCurrent Consulting

Data as of 31 May 2023

Background

  • Founded in March 1998 as PC Works Co. Ltd for the purpose of consulting, system integration and outsourcing related to management, operations and IT. In December 2006, PC Works Co. Ltd changed its name to BayCurrent Consulting Co. Ltd. In April 2014, Byron Holdings Co. Ltd was set up. In June 2014, Byron Holdings Co. Ltd acquired BayCurrent Consulting Co. Ltd and then the combined entity changed its name to BayCurrent Consulting Co. Ltd.
  • HQ: Tokyo, Japan
  • Listed on September 2016 on the Tokyo Stock Exchange Mother’s section; moved to First Section of Tokyo Stock Exchange on December 2018; moved to Prime Market of the Tokyo Stock Exchange on April 2022
  • Ticker: TSE: 6532
  • Total number of consultants as of FY2023 (financial year ended February 2023) is 2,961; total number of employees as of FY2023 is 3,310

Business

  • BayCurrent is a consulting firm that supports a wide range of themes such as strategy, digital, and operations for Japan’s leading companies in various industries. BayCurrent provides planning and execution support to clients, such as company-wide strategy planning and business strategy planning to support decision-making by management, and support for examining business operations using digital technology.
  • Examples of the projects that BayCurrent is currently working on under Digital Consulting:
    • Finance, Cashless payment, and Design: Building a UX improvement process to continue achieving high customer satisfaction over the long term
    • Pharmaceutical manufacturing, Digital technologies, and Market research: Formulating plans to enter the Japanese market of advanced digital medical equipment business for foreign companies 
    • Telecommunication, Metaverse, and Business planning: Developing plans to use metaverse and examine the use of AI toward the smart city concept
    • Automobiles, AI, and Business creation: Building a model for business using AI and supporting its implementation, aiming to reduce the risk of traffic accidents
  • Examples of the projects that BayCurrent is currently working on under Sustainability Consulting:
    •  Energy, ESG, and Support for practice: Forming a scheme and supporting negotiations for realizing offshore wind power business
    • Finance and Carbon neutrality: Considering policies in response to TCFD (Task Force on Climate-Related Financial Disclosures) in anticipation of sales of solutions in the future
    • High-tech, EV, and Business planning: Considering business domains and creating a road map for popularizing EVs (electric vehicles) to reduce CO2 emissions
    • Manufacturing, ESG, and Supply chain management: Considering the possibility of commercializing supplier ESG assessments and risk management
  • See also Figures 1, 2, 3, and 4 for examples of BayCurrent’s projects
Figure 1
Figure 2
Figure 3
Figure 4
  • BayCurrent groups its customers into three industry categories: Finance (banking, securities, insurance etc); Telecommunications/Media/High-Tech; and Others (energy, entertainment, government offices, food etc). In FY2023, 25% of revenue was from Finance, 35% was from Telecommunications/Media/High-Tech, and 40% from Others. In FY2019, the split was 40% from Finance, 30% from Telecommunications/Media/High-Tech, and 30% from Others. BayCurrent’s largest customer in FY2023 was Pfizer Japan, accounting for 12.0% of revenue; it seems like there’s no other company that accounted for more than 10% of revenue during the year.
  • In FY2023, revenue from customers based in Japan was at least 90% of BayCurrent’s total revenue.

Market opportunity

  • According to IDC Japan’s “Forecast for domestic business consulting market: 2021-2025” (announced on 1 July 2021), the Japanese consulting market is expected to have a CAGR of 7.8% from around ¥900 billion in 2020 to more than ¥1.2 trillion in 2025; within the consulting market is the digital consulting sub-segment which is expected to have a CAGR of 30.1% from more than ¥100 billion in 2020 to around ¥500 billion in 2025. BayCurrent ended FY2023 with revenue of just ¥76.1 billion.
  • According to BayCurrent: “In today’s business environment, the challenges faced by corporate managers are becoming more diverse and complex due to intensifying market competition and changes in market structure. There is a growing need for consultants with a high level of expertise. Furthermore, with the further development of digital technology in the future, the need for the utilization of new technologies in business is expected to increase year by year, and the consulting market is expected to continue to grow at a high rate.”
  • In Japan, there’s an initiative called DX (Digital Transformation) that began to be promoted heavily by the Japanese government starting in 2018 with the publication of the “DX [Digital Transformation]” report by the Ministry of Economy, Trade, and Industry (METI) during the year. METI warned that Japan would face an economic loss of ¥12 trillion per year by 2025 if traditional mainframes and backbone core systems were not updated and the shortage of ICT engineers were not addressed. Moreover, in 2016, the percentage of companies that have been operating their core systems for 21 years or more is 20%, and 40% for companies that have been in operation for 11 to 20 year; if this situation continues in 10 years, in 2025, the percentage of companies that have been operating core systems for 21 years or more will be 60%. Japanese companies appear to have heeded the government’s DX call. Surveys conducted by the METI and FUJITSU in 2020 indicated that almost half of the SMEs were actively promoting DX companywide, while large companies with more than 5.000 employees indicate an adoption rate close to 80%. These are a tailwind for BayCurrent Consulting.

Growth strategy

  • BayCurrent is focused on further increasing the added value of its consulting services; the recruitment and training of human resources; and providing an attractive work environment. 
  • BayCurrent’s support services for corporate managers in all industries are knowledge-intensive, and so management believes that improvements in the company’s consultants’ ability to make proposals and solve problems will affect its growth. For this reason, management strives to recruit excellent human resources with various backgrounds and focusing on creating an environment and treatment that makes it easy for each consultant to work with peace of mind. Management has established a wide variety of training programs and study sessions to improve its consultants’ skills for strategic planning and solving management issues. Management believes that BayCurrent is able to formulate viable strategies that meet the needs of clients precisely because the company’s consultants are professionals who have worked on numerous projects across industries and service areas; for this reason, management strives to not limit its consultants to specific fields. Figure 5 shows the establishment of the BayCurrent Institute, a business management research institute.
  • Management also distributes knowledge obtained through dialogue with university professors working on research subjects and members of the management teams of leading companies, in order to gain visibility from the public. Most recent examples of such work:
    • Participated in FIN/SUM, one of Japan’s largest fintech conferences, co-hosted by the Financial Services Agency and Nikkei Inc. BayCurrent did the following: Joji Noritake, Managing Executive Officer and CDO, conducted a standalone lecture on “Sustainable customer experience connects emotional memories”; took part in panel discussion on “Possibility of future individual investment through digital technology”
    • Participation in Green CPS Consortium, an organization aimed at building eco-friendly industry and society by controlling material loss, energy loss, and other aspects in all economic activities while driving economic growth
    • Made a donation to the VR/metaverse in the corporate sponsored practical research program of the University of Tokyo Virtual Reality Educational Research Center. The research program conducts basic research on the creation and operation of metaverse space and conducts demonstration experiments to develop practical applications of the metaverse in society. 
  • Growth of number of consultants vs growth of revenue (note the higher revenue growth vs consultant growth):
Table 1
Figure 5

Financials

  • Financials from FY2016 to FY2023 (financials in ¥; earliest data we could find was for FY2016): 
Table 2
  • Solid CAGRs in revenue:
    • FY2016-FY2023: 25.1%
    • FY2018-FY2023: 30.1%
    • FY2023: 32.4%
  • Profitable since at least FY2016. Net income CAGRs and average net income margins:
    • FY2016-FY2023: 52.3% CAGR, 15.3% average margin
    • FY2018-FY2023: 60.3% CAGR, 18.1% average margin
    • FY2023: 43.3% growth, 27.6% margin
  • Positive operating cash flow since at least FY2016. Operating cash flow CAGRs and average operating cash flow margins:
    • FY2016-FY2023: 34.0% CAGR, 19.4% average margin
    • FY2018-FY2023: 45.0% CAGR, 21.6% average margin
    • FY2023: 35.5% growth, 27.2% margin
  • Free cash flow positive since at least FY2016. Free cash flow CAGRs and average free cash flow margins:
    • FY2016-FY2023: 34.0% CAGR, 19.1% average margin
    • FY2018-FY2023: 45.8% CAGR, 21.3% average margin
    • FY2023: 33.6% growth, 26.7% margin
  • Balance sheet was initial in net-debt position and became net-cash in FY2020 onwards; high net-cash position of ¥33 billion in FY2023
  • Minimal dilution as weighted average diluted share count increased by only 0.8% per year for FY2016-FY2023, and -0.3% in FY2023
  • Management aims for a total shareholder return ratio (dividends and share buybacks) of around 40% of earnings; dividend payout ratio is typically 20%-30% under IFRS. In FY2023, interim dividend of ¥14 per share (adjusting for 1-for-10 stock split in November 2022) and final dividend of ¥23 per share, for a total dividend of ¥37 per share for FY2023, representing a payout ratio of 27%.

Management

  • Yoshiyuki Abe, 57, is President and CEO. Became President in December 2016. Joined the original BayCurrent Consulting Co. Ltd in September 2008 and became an executive director in November of same year. Yoshiyuki Abe became President in December 2016 after some major turmoil at BayCurrent that happened in H2 2016:
    • Failed to gain deals matching waiting consultants and then suffered a largely lowered operation rate
    • Additionally faced the defection of employees as a result of a talk about withdrawal that resulted in the loss of credibility of the clients receiving the support for many years
    • Revised earnings forecasts downwardly on 9 December 2016; on the same day, the former President left office
  • Kentaro Ikehira, 46, is Executive Vice President. Became Vice President in May 2021. Joined the original BayCurrent Consulting Co. Ltd in September 2007.
  • Kosuke Nakamura, 41, is CFO. Became CFO in May 2021. Joined the original BayCurrent Consulting Co. Ltd in January 2007.
  • Management has a long history of significantly beating their own mid-term growth projections. Examples:
    • In FY2018 earnings presentation, a projection for FY2019-FY2021 was given where revenue was expected to have a CAGR of 15%-20%, ending at ¥32-35 billion. Actual FY2021 revenue was ¥42.8 billion. 
    • In FY2022 earnings presentation, a projection for FY2022-FY2026 was given where revenue was expected to have a CAGR of 20% to end at ¥100 billion and EBITDA was expected to end at ¥30 billion. Projection given for FY2024 was for revenue of ¥94.6 billion and EBITDA of ¥36 billion – so FY2026 medium-term projection could be achieved/beat by as early as FY2024
  • Management has set a target of FY2029 revenue of ¥250 billion, which represents a 20% CAGR from FY2024’s projected revenue of ¥94.6 billion.

Compensation of Management

  • Yoshiyuki Abe’s total FY2023 compensation was ¥333 million, consisting of ¥40 million of fixed pay, ¥192 million of performance-linked remuneration, and ¥101 million of restricted stock compensation. Total compensation in FY2023 was just 1.6% of FY2023 net income as well as free cash flow
  • Yoshiyuki Abe’s tota FY2022 compensation was ¥297 million, FY2021 compensation was ¥206 million, and FY2020 compensation was ¥137 million.
  • Comparison of Yoshiyuki Abe’s compensation growth vs BayCurrent’s revenue/net income/FCF growth over past few years:
Table 3

Valuation (as of 31 May 2023)

  • 31 May 2023 share price of ¥5,110
  • Trailing revenue per share is ¥496.47, hence PS is 10.3
  • Trailing diluted EPS is ¥137.19, hence PE is 37.2
  • Trailing FCF per share is ¥132.71, hence PFCF is 38.5
  • Reminder that revenue growth projection for FY2029 is for CAGR of 20% from FY2024 – the valuation does not look too rich if BayCurrent is able to grow as projected 

Disclaimer: The Good Investors is the personal investing blog of two simple guys who are passionate about educating Singaporeans about stock market investing. By using this Site, you specifically agree that none of the information provided constitutes financial, investment, or other professional advice. It is only intended to provide education. Speak with a professional before making important decisions about your money, your professional life, or even your personal life. We currently have no vested interest in any company mentioned. Holdings are subject to change at any time.

Company Notes Series: Natural Resource Partners

Editor’s note: We’re testing out a new series for the blog, the “Company Notes Series”, where we periodically share our notes on companies we’ve studied in the recent past but currently have no vested interest in (we may invest in or sell shares in the companies mentioned at any time). The notes are raw and not updated, and the “as of” date for the data is given at the start of the notes. Please give us your thoughts on the new series through the “Contact Us” page; your feedback will determine if we continue with it. Thanks in advance!


Start of notes for Natural Resource Partners

Data as of 9 January 2024

Background on company

  • Company name: Natural Resource Partners LP
  • Ticker: NYSE: NRP
  • Structure: Publicly traded Delaware limited partnership formed in 2002
  • Natural Resource Partners LP’s operations are conducted through Opco and its operating assets are owned by its subsidiaries, where Opco refers to NRP (Operating) LLC, a wholly owned subsidiary of Natural Resource Partners LP.  NRP (GP) LP is the general partner and has sole responsibility for conducting Natural Resource Partners LP’s business and for managing its operations. Because NRP (GP) LP is a limited partnership, its general partner, GP Natural Resource Partners LLC, conducts its business and operations; the Board of Directors and officers of GP Natural Resource Partners LLC also makes the decisions for Natural Resource Partners LP. Robertson Coal Management LLC, a company wholly owned by Corbin Robertson, Jr., owns all of the membership interests in GP Natural Resource Partners LLC. 
  • The senior executives who manage Natural Resource Partners LP are employees of Western Pocahontas Properties Limited Partnership or Quintana Minerals Corporation, which are both controlled by Corbin Robertson Jr.
  • Neither GP Natural Resource Partners LLC nor any of its affiliates receive any management fee or other compensation in connection with the management of Natural Resource Partners LP apart from reimbursement for all direct and indirect expenses incurred on the behalf of Natural Resource Partners LP. 

Business

  • Natural Resource Partners LP has two segments: Mineral Rights, and Soda Ash
  • In 9M 2023, Natural Resource Partners LP’s total revenue was US$275.9 million and 79% was from Mineral Rights (US$217.3 million) and 22% was from Soda Ash (US$58.6 million). In 2022, Natural Resource Partners LP’s total revenue was US$389.0 million and 85% was from Mineral Rights (US$329.2 million) and 15% was from Soda Ash (US$59.8 million)

Business – Mineral Rights segment

  • The Mineral Rights segment consists of 13 million acres of mineral interests and other subsurface rights – including coal and other natural resources – across the US; if combined in a single tract, the ownership would cover roughly 20,000 square miles. The ownership provides critical inputs for the manufacturing of steel, electricity, and basic building materials, as well as opportunities for carbon sequestration and renewable energy. Natural Resource Partners is working to strategically redefine its business as a key player in the transitional energy economy in the years to come. Figure 1 below shows Natural Resource Partners LP’s geographic distribution of its ownership. 
Figure 1
  • Under the Mineral Rights segment, Natural Resource Partners LP does not mine, drill, or produce minerals. Instead, the limited partnership leases its acreage to companies engaged in the extraction of minerals in exchange for royalties and various other fees. The royalties are generally a percentage of the gross revenue received by lessees (the companies that extract the minerals), and are typically supported by a floor price and minimum payment obligation that protects Natural Resource Partners LP during significant price or demand declines. The majority of revenue from the Mineral Rights segment revenues come from royalties related to the sale of coal. Of the Mineral Rights segment’s US$217.3 million in revenue in 9M 2023, US$170.8 million came from Coal Royalty revenue, so Coal Royalty Revenue was 62% of Natural Resource Partners LP’s total revenue in 9M 2023; of the Mineral Rights segment’s US$329.2 million in revenue, in 2022, US$227.0 million came from Coal Royalty revenue, so Coal Royalty Revenue was 58% of Natural Resource Partners LP’s total revenue in 2022.  Natural Resource Partners LP’s coal is primarily located in the Appalachia Basin, the Illinois Basin, and the Northern Powder River Basin. Natural Resource Partners LP’s coal-related leases are typically long-term in nature – at end-2022, two-thirds of royalty-based leases have initial terms of 5 to 40 years, with substantially all lessees having the option to extend the lease for additional terms. Leases include the right to renegotiate royalties and minimum payments for the additional terms. 
  • Figure 2 below shows all the other revenue sources for the Mineral Rights segment in 9M 2023 and 9M 2022:
Figure 2
  • There are two kinds of coal, and Natural Resource Partners LP participates in both in its Mineral Rights segment:
    • Metallurgical coal, or met coal, is used to fuel blast furnaces that forge steel and is the primary driver of Natural Resource Partners LP’s long-term cash flows. Met coal is a high-quality, cleaner coal that generates exceptionally high temperatures when burned and is an essential element in the steel manufacturing process. Natural Resource Partners LP’s met coal is located in the Northern, Central and Southern Appalachian regions of the United States.
    • Thermal coal, sometimes referred to as steam coal, is used in the production of electricity. The amount of thermal coal produced in the US has been falling over the last decade as energy providers shift to natural gas and to a lesser extent, alternative energy sources such as geothermal, wind, and solar. Management believes thermal coal’s long-term secular decline will continue. This, together with the long-term strength of the met coal business and Natural Resource Partners LP’s carbon neutral initiatives mean that thermal coal will be a diminishing contributor to Natural Resource Partners LP’s business in the future. The vast majority of the limited partnership’s thermal coal sales are located in Illinois and its operations are some of the most cost-efficient mines east of the Mississippi River. The remainder of Natural Resource Partners LP’s thermal coal is located in Montana, the Gulf Coast and Appalachia.
    • Met coal tends to be priced higher than thermal coal.
    • In 2022, 70% of Natural Resource Partners LP’s Coal Royalty revenues and approximately 45% of coal royalty sales volumes were derived from metallurgical coal.
    • Figure 3 shows the types of coal production of Natural Resource Partners LP from various properties in 2022, and Figure 4 shows the limited partnership’s significant coal royalty properties in 2022.
Figure 3

Figure 4

  • Under the Mineral Rights segment, Natural Resource Partners LP also participates in the sequestration of carbon dioxide underground. Similar to its Coal Royalty business, Natural Resource Partners LP only plans to lease acreage to companies that will conduct carbon dioxide sequestration. Natural Resource Partners LP owns approximately 3.5 million acres of specifically reserved subsurface rights in the southern US with the potential for permanent sequestration of greenhouse gases. The carbon capture utilization and storage industry is in its infancy but a few facts are clear. A sequestration project requires acreage possessing unique geologic characteristics, close proximity to sources of industrial-scale greenhouse gas emissions, and the appropriate form of legal title that grants the acreage owner the right to sequester emissions in the subsurface. Although carbon sequestration rights and ownership continue to evolve, management believes that Natural Resource Partners LP owns one of the largest acreages in the USA with potential for carbon sequestration activities. In 2022 Q1, Natural Resource Partners LP leased its first acreages (75,000 acres) for subsurface carbon dioxide sequestration in underground pore space in southwest Alabama, with the potential to store over 300 million metric tons of carbon dioxide; in October of 2022, the second subsurface carbon dioxide sequestration lease was signed, this time for 65,000 acres of pore space near southeast Texas, with an estimated storage capacity of at least 500 million metric tons of carbon dioxide. At end-2022, Natural Resource Partners LP had 140,000 acres of pore space under lease for carbon dioxide sequestration, with estimated carbon dioxide storage capacity of 800 million metric tons.

Business – Soda Ash segment

  • The Soda Ash segment consists of 49% non-controlling equity interest in Sisecam Wyoming, a trona ore mining and soda ash production business located in the Green River Basin of Wyoming. Sisecam Wyoming mines trona and processes it into soda ash that is sold both in the USA and internationally into the glass and chemicals industries.
  • Sisecam Resources LP runs Sisecam Wyoming and owns the other 51%. Natural Resource Partners LP is not involved in the day-to-day operation of Sisecam Wyoming, although Natural Resource Partners LP is able to appoint – and has appointed – 3 of the 7 members of Sisecam Wyoming’s Board of Managers.
    • In December 2021, Sisecam Resources LP changed majority-owners. Before this, Sisecam Wyoming was named Ciner Wyoming, and Sisecam Resources LP was named Ciner Resources LP. Under the terms of the transaction, Ciner Enterprises Inc, which controls 74% of Ciner Resources LP, effectively sold 60% of its interests in Ciner Resources LP to Sisecam Chemicals USA Inc, an indirect subsidiary of Turkish conglomerate Türkiye Şişe ve Cam Fabrikalari A.Ş. Ciner Resources LP subsequently changed its name to Sisecam Resources LP. 
    • In February 2023, Sisecam Resources LP announced that it would be fully acquired by Sisecam Chemicals Resources LLC. Sisecam Chemicals Resources LLC is in turn, 60% owned by Sisecam Chemicals USA Inc. The acquisition price of Sisecam Resources LP is US$25 per unit for all the units of Sisecam Resources LP that were not controlled by Sisecam Chemicals USA Inc (from the above, Sisecam Chemicals USA Inc already controlled 60% of Sisecam Resources LP – see Appendix for more). Sisecam Resources LP’s total unit count as of 31 March 2023 was 19.8 million, so Sisecam Resources LP was valued by Sisecam Chemicals USA Inc at US$495 million. Sisecam Resources LP’s only business interest is its 51% stake in Sisecam Wyoming; so if Sisecam Resources LP was valued at US$495 million, the entire Sisecam Wyoming is worth US$971 million, and Natural Resources LP’s 49% stake in Sisecam Wyoming is worth US$476 million.
  • Sisecam Wyoming is one of the largest and lowest cost producers of soda ash in the world, serving a global market from its facility located in the Green River Basin of Wyoming. The Green River Basin geological formation holds the largest, and one of the highest purity, known deposits of trona ore in the world, in fact the vast majority of the world’s accessible trona is located in the Green River Basin. Trona is a naturally occurring soft mineral and is also known as sodium sesquicarbonate. Trona consists primarily of sodium carbonate (or soda ash), sodium bicarbonate, and water. Sisecam Wyoming processes trona ore into soda ash, which is an essential raw material in flat glass, container glass, detergents, chemicals, paper and other consumer and industrial products.
  • Around 30% of global soda ash is produced by processing trona, with the remainder being produced synthetically through chemical processes. Synthetic production of soda ash is more expensive than the costs for mining trona for trona-based production. In addition, trona-based production consumes less energy and produces fewer undesirable by-products than synthetic production.
  • Sisecam Wyoming’s Green River Basin surface operations are situated on approximately 2,360 acres in Wyoming (of which, 880 acres are owned by Sisecam Wyoming), and its mining operations consist of approximately 24,000 acres of leased and licensed subsurface mining area. 

Business – Customers

  • There is customer concentration for the whole of Natural Resource Partners LP, and also for the Soda Ash segment.
  • Natural Resource Partners LP’s revenue from (1) Alpha Metallurgical Resources was US$102.4 million in 2022, which accounted for 37% of the year’s total revenue and (2) Foresight Energy Resources was US$65.6 million, which accounted for 24% of the year’s total revenue.
  • For the Soda Ash segment, the two largest customers of Sisecam Wyoming are distributors in its export network that collectively made up 26% of its total gross revenue.

Business – Commodity prices

  • Even though Natural Resource Partners LP’s royalty fees are typically supported by a floor price and minimum payment obligation that protects Natural Resource Partners LP during significant price or demand declines, the limited partnership is still affected by price swings in commodity prices.
  • In 2022, met coal and thermal coal prices both reached record highs in 2022; met coal prices was the primary driver of Natural Resource Partners LP’s strong Mineral Rights segment performance in 2022. See Table 1 below for Mineral Rights segment performance in 2022.
  • In 9M 2023, met coal and thermal coal prices were both below record highs seen in 2022 – the Mineral Rights segment saw a dip in performance in 9M 2023, as shown in Table 1.
Table 1

Management

  • Corbin Robertson, Jr, 75, has served as CEO and Chairman of the Board of Directors of GP Natural Resource Partners LLC since 2002; GP Natural Resources LLC has managed Natural Resource Partners LP since its formation and listing in 2002.
  • 2015 was a tough year for Natural Resource Partners LP as commodity prices crashed and it had too much debt. Since then, Natural Resource Partners LP has dramatically improved its financial health. See Figures 5, 6, and 7.
Figure 5
Figure 6
Figure 7

Valuation

  • Unit price of Natural Resource Partners LP: US$96.93
  • Market cap of Natural Resource Partners LP: US$1.225 billion
  • Enterprise value of Natural Resource Partners LP: US$1.41 billion
  • Value of Natural Resource Partners LP’s stake in Sisecam Wyoming is US$476 million, so the market is assigning a value of US$938 million for the Mineral Rights segment
  • Trailing free cash flow as of 30 Sep 2023 is US$304 million (lion’s share comes from the Mineral Rights segment since most of net income is from the segment), so the Mineral Rights segment is valued at just 3x FCF. Worth noting that Natural Resource Partners LP’s FCF has been relatively stable since 2015 – see Figure 8
  • In Figure 6 above, it is worth noting that Natural Resource Partners LP’s aim is to “retire all permanent debt, redeem all the 12% preferred equity, and eliminate all outstanding warrants, all of which will require approximately US$325 million.” 
  • On the 12% preferred equity, Natural Resource Partners LP issued US$250 million of the preferred equity units in March 2017 at a price of US$1,000 per preferred equity unit. The preferred equity is convertible to common units, but Natural Resource Partners LP can choose to redeem the preferred equity for cash. The outstanding balance of the preferred equity as of 30 September 2023 is US$72 million. Once all the preferred equity is cleared, Natural Resource Partners LP can save US$30 million in annual coupon payments (based on US$250 million issue), and this adds directly to free cash flow; if the US$72 million outstanding balance is fully cleared, Natural Resource Partners LP can save US$8.6 million in annual coupon payments.
Figure 8


Appendix

Chart showing Sisecam Wyoming and Sisecam Resources LP’s ownership structure before and after the February 2023 announcement of the acquisition by Sisecam Chemicals USA


Disclaimer: The Good Investors is the personal investing blog of two simple guys who are passionate about educating Singaporeans about stock market investing. By using this Site, you specifically agree that none of the information provided constitutes financial, investment, or other professional advice. It is only intended to provide education. Speak with a professional before making important decisions about your money, your professional life, or even your personal life. We currently have no vested interest in any company mentioned. Holdings are subject to change at any time.