Although Hyflux has found a white knight, its investors still don’t have much to smile over. Here are the important lessons we can learn from Hyflux.
News broke yesterday that the embattled water treatment firm Hyflux has finally signed a S$400 million rescue deal with Utico, a utilities company based in the Middle East.
Although Hyflux has now been given a lifeline with Utico injecting capital, shareholders and creditors of the water treatment company don’t have much to smile over. There are important lessons we can learn from Hyflux’s experience.
Painful lifeline
Hyflux and Utico’s agreement came after months of talks between the two. It had also been over a year since Hyflux filed for bankruptcy protection in May 2018 and suspended the trading of its ordinary shares, preference shares, and perpetual securities.
The rescue deal will see Utico take a 95% stake in Hyflux at a value of S$300 million. This means that all of Hyflux’s existing owners of ordinary shares will emerge holding 5% of the company, with a value of merely S$15.8 million. Just prior to the May 2018 trading suspension, Hyflux had a total market value (or market capitalisation) of S$165 million. In other words, Hyflux’s ordinary shareholders are now facing a haircut of around 90%.
Meanwhile, there are 34,000 individuals who hold Hyflux’s preference shares and/or perpetual securities that collectively have a face value of S$900 million. Utico’s rescue deal will see these 34,000 individuals receive total payment ranging from only S$50 million to S$100 million. Even at a S$100 million payout, the owners of Hyflux’s preference shares and perpetual securities are still staring at a loss of 89%.
Avoiding disasters
It’s great timing that a user of the community forums of personal finance portal Seedly asked a question yesterday along the lines of “How can we avoid Hyflux-like disasters?” I answered, and I thought my response is worth sharing with a wider audience, hence me writing this article. Parts of my answer are reproduced below (with slight tweaks made for readability):
“I’m not a pro, nor will I wish anyone to follow my investing thoughts blindly. But I used to write for The Motley Fool Singapore, and I wrote a piece on Hyflux in May 2016 when the company issued its S$300 million, 6% perpetual securities [the offering was eventually upsized to S$500 million].
The Fool SG website is no longer available, but there’s an article from The Online Citizen published in June 2018 that referenced my piece.
Back then, I concluded that Hyflux’s perpetual securities were risky after looking through the company’s financials. That was because the company had a chronic inability to generate cash flow and its balance sheet was really weak. Those risks sadly flared up in 2018 and caused pain for so many of the company’s investors.
What I wrote was this: “According to data from S&P Global Market Intelligence, Hyflux has been generating negative cash flow from operations in each year from 2010 to 2015. Meanwhile, the company currently has a net-gearing ratio (net debt to equity ratio) of 0.98, which isn’t low.””
What I shared was the financial traits I found in Hyflux that made me wary about the company. The great thing about those traits are that they can be applied to most situations in investing.
Simple rules
In my response to the Hyflux question in Seedly, I also mentioned (emphasis is added now):
“There are many things about a company to look at when investing. But I believe there are some simple rules that can help us avoid trouble. The rules are not fool-proof and nothing is fool-proof in investing, but they do work in general. The rules are: (1) Be careful when a company is unable to produce cash flow from its business consistently; and (2) be careful when the company’s balance sheet is burdened heavily by debt.”
The parts in italics above are rules that I believe are simple, yet incredibly effective. They also form part of my investment framework. Those rules are sometimes meant to be broken, as is the case with my decision to stay invested in Netflix, which has trouble generating cash flow and a heavy debt load for a good reason. But if we stick to the two rules with discipline, I believe we can keep ourselves out of trouble in the stock market most of the time.
Disclaimer: The Good Investors is the personal investing blog of two simple guys who are passionate about educating Singaporeans about stock market investing. By using this Site, you specifically agree that none of the information provided constitutes financial, investment, or other professional advice. It is only intended to provide education. Speak with a professional before making important decisions about your money, your professional life, or even your personal life.
My family’s portfolio has owned Netflix shares for eight years, and this is why we continue to own it.
Netflix (NASDAQ: NFLX) is one of the companies that’s in my family’s portfolio. I first bought Netflix shares for the portfolio in September 2011 at a price of US$26, again in March 2012 at US$16, and yet again in August 2017 at US$170. I’ve not sold any of the shares I’ve bought.
The company has done really well for my family’s portfolio, with its share price rising to around US$300 now. But it is always important to think about how a company’s business will evolve going forward. What follows is my thesis for why I still continue to hold Netflix’s shares.
Company description
Netflixis based and listed in the US. When it IPO-ed in 2002, Netflix’s main business was renting out DVDs by mail. It had 600,000 subscribers back then, and had an online website for its members to access the rental service.
Today, Netflix’s business is drastically different. In the first nine months of 2019, Netflix pulled in US$14.7 billion in revenue, of which 98% came from streaming; the remaining 2% is from the legacy DVD-by-mail rental business. The company’s streaming content includes TV series, documentaries, and movies across a wide variety of genres and languages. These content are licensed from third parties or produced originally by Netflix.
Many of you reading this likely have experienced Netflix’s streaming service, so it’s no surprise that Netflix has an international presence. In the first nine months of 2019, 48% of Netflix’s revenue came from the US, with the rest spread across the world (Netflix operates in over 190 countries). The company counted 158.3 million subscribers globally as of 30 September 2019.
Investment thesis
I will describe my investment thesis for Netflix according to the investment framework (consisting of six criteria) that I previously laid out in The Good Investors.
1. Revenues that are small in relation to a large and/or growing market, or revenues that are large in a fast-growing market
Netflix already generates substantial revenue and has a huge base of 158.3 million subscribers. But there’s still plenty of room for growth.
According to Statista, there are 1.05 billion broadband internet subscribers worldwide in the first quarter of 2019. Netflix has also been testing a lower-priced mobile-only streaming plan in India. The test has done better-than-expected and Netflix is looking to test mobile-only plans in other countries too. Data from GSMA showed that there were 3.5 billion mobile internet subscribers globally in 2018.
I’m not expecting Netflix to sign up the entire global broadband or mobile internet user base – Netflix is not in China, and I doubt it will ever be allowed into the giant Asian nation. But there are still significantly more broadband and mobile internet subscribers in the world compared to Netflix subscribers, and this is a growth opportunity for the company. It’s also likely, in my view, that the global number of broadband as well as mobile internet users should continue to climb in the years ahead. This grows the pool of potential Netflix customers.
For another perspective, the chart immediately below illustrates clearly that cable subscriptions still account for the lion’s share of consumer-dollars when it comes to video entertainment. This is again, an opportunity for Netflix.
Subscribers to online subscription video services across the world has also exploded in the past few years. This shows how streaming is indeed a fast-growing market – and in my opinion, the way of the future for video entertainment.
As a last point on the market opportunity for Netflix, as large as the company already is in the US, it still accounts for only 10% of consumers’ television viewing time in the country, and even less of their mobile screen time.
2. A strong balance sheet with minimal or a reasonable amount of debt
At first glance, Netflix does not cut the mustard here. As of 30 September 2019, Netflix’s balance sheet held US$12.4 billion in debt and just US$4.4 billion in cash. This stands in sharp contrast to the end of 2014, when Netflix had US$900 million in debt and US$1.6 billion in cash. Moreover, Netflix has lost US$9.3 billion in cumulative free cash flow from 2014 to the first nine months of 2019.
But I’ll explain later why I think Netflix has a good reason for having so much debt on its balance sheet.
3. A management team with integrity, capability, and an innovative mindset
On integrity
Netflix is led by CEO Reed Hastings, 58, who also co-founded the company in 1997. The long-tenure of Hastings in Netflix is one of the things I like about the company.
Although Hastings is paid a tidy sum to run Netflix – his total compensation in 2018 was US$36.1 million – his pay has reasonably tracked the company’s revenue growth. From 2014 to 2018, Netflix’s revenue nearly tripled from US$5.5 billion to US$15.8 billion. This matches the 326% jump in Hastings’ total compensation from US$11.1 million to US$36.1 million over the same period.
Hastings also owns 5.56 million Netflix shares as of 8 April 2019, along with the option to purchase 4.50 million shares. His ownership stake alone is worth around US$1.7 billion at the current share price, which will very likely align his interests with other Netflix shareholders.
On capability and innovation
Netflix was an early pioneer in the streaming business when it launched its service in 2007. In fact, Netflix probably wanted to introduce streaming even from its earliest days. Hastings said the following in a 2007 interview with Fortune magazine:
“We named the company Netflix for a reason; we didn’t name it DVDs-by-mail. The opportunity for Netflix online arrives when we can deliver content to the TV without any intermediary device.”
When Netflix first started streaming, the content came from third-party producers. In 2013, the company launched its first slate of original programming. Since then, the company has ramped up its original content budget significantly.
The table below shows Netflix’s total content cash spending from 2014 to 2018. There are two things to note. First, total content spending has been increasing each year and has jumped by around 340% for the entire time frame. Second, around 85%, or US$11 billion, of Netflix’s content spending in 2018 was for original content. Netflix’s content budget for 2019 is projected to be around US$15 billion, most of which is again for original content.
Source: Netflix earnings
All that content-spending has resulted in strong subscriber growth, which is clearly seen from the table below. Netflix’s decade-plus head start in streaming – a move that I credit management for – has also given the company a tremendously valuable asset: Data. The data lets Netflix know what people are watching, and in turn allows the company to predict what people want to watch next. This is very helpful for Netflix when producing original content that keeps viewers hooked.
Source: Netflix earnings
And Netflix has indeed found plenty of success with its original programming.For instance, in 2013, the company became the first streaming provider to be nominated for a primetime Emmy. In 2018 and 2019, the company snagged 23 and 27 Emmy wins, respectively. From a viewership perspective, the third season of Stranger Things (I love the show!), launched in the third quarter of 2019, had 64 million households tuning in within the first month of its release. Adam Sandler’s comedy film, Murder Mystery, welcomed views from over 73 million households in the first month of its release in June this year.
The move into originals by management has also proved to be prescient. Netflix’s 2019 second quarter shareholders’ letter name-dropped nine existing and would-be streaming competitors – and there are more that are unnamed. I think Netflix’s aforementioned data, and its strong library of original content, should help it to withstand competition.
I also want to point out the unique view on Netflix’s market opportunity that management has. Management sees Netflix’s competition as more than just other streaming providers. In Netflix’s Long-Term Viewletter to investors, management wrote:
“We compete for a share of members’ time and spending for relaxation and stimulation, against linear networks, pay-per-view content, DVD watching, other internet networks, video gaming, web browsing, magazine reading, video piracy, and much more. Over the coming years, most of these forms of entertainment will improve.
If you think of your own behavior any evening or weekend in the last month when you did not watch Netflix, you will understand how broad and vigorous our competition is.
We strive to win more of our members’ “moments of truth”.”
Having an expansive view on competition lessens the risk that Netflix will get blindsided by competitors, in my view.
4. Revenue streams that are recurring in nature, either through contracts or customor-behaviour
Netflix’s business is built entirely on subscriptions, which generate recurring revenue for the company. As I already mentioned, nearly all of Netflix’s revenue in the first nine months of 2019 (98%) came from subscriptions to its streaming service, while subscriptions to the DVD-by-mail service accounted for the remaining small chunk of revenue.
But just having a subscription model does not equate to having recurring revenues. If your business has a high churn rate (the rate of customers leaving), you’re constantly filling a leaky bucket. That’s not recurring income. According to a recent estimate from a third-party source (Lab42), Netflix’s churn rate is just 7%, and is much better than its competitors.
5. A proven ability to grow
2007 was the year Netflix first launched its streaming service. This has provided the impetus for the company’s stunning revenue and net income growth since, as the table below illustrates. It’s good to note too that Netflix’s diluted share count has actually declined since 2007.
Source: Netflix annual reports
In my explanation of this criterion, I mentioned that I’m looking for “big jumps in revenue, net profit, and free cash flow over time.” I also said that “I am generally wary of companies that (a) produce revenue and profit growth without corresponding increases in free cash flow.” So why am I holding Netflix shares when its free cash flow has cratered over time and is deeply in red at the moment?
This is my view on the situation. Netflix has been growing its original content production, as mentioned earlier, and the high capital outlay for such content is mostly paid upfront. But the high upfront costs are for the production of content that (1) could have a long lifespan, (2) can be delivered to subscribers at minimal cost, and (3) could satisfy subscribers who have high lifetime value (the high lifetime value is inferred from Netflix’s low churn rate). In other words, Netflix is spending upfront for content, but has the potential to reap outsized rewards over a long period of time at low cost. The shelf-life for good content could be decades, or more – for instance, Seinfeld, a sitcom in the US, is still popular 30 years after it was produced.
In Netflix’s Long-Term View shareholder’s letter, management wrote (emphases are mine):
“People love movies and TV shows, but they don’t love the linear TV experience, where channels present programs only at particular times on non-portable screens with complicated remote controls. Now streaming entertainment – which is on-demand, personalized, and available on any screen – is replacing linear TV.
Changes of this magnitude are rare. Radio was the dominant home entertainment media for nearly 50 years until linear TV took over in the 1950’s and 1960’s. Linear video in the home was a huge advance over radio, and very large firms emerged to meet consumer desires over the last 60 years. The new era of streaming entertainment, which began in the mid-2000’s, is likely to be very big and enduring also, given the flexibility and ubiquity of the internet around the world. We hope to continue being one of the leading firms of the streaming entertainment era.”
I agree with Netflix’s management that the company is in the early stages of a multi-decade transition from linear TV to internet entertainment at a global scale. With this backdrop, along with what I mentioned earlier on Netflix’s business model of spending upfront to produce content with long monetisable-lifespans, I’m not troubled by Netflix’s negative and deteriorating free cash flow for now. Netflix’s management also expects free cash flow to improve in 2020 compared to 2019, and “to continue to improve annually beyond 2020.”
6. A high likelihood of generating a strong and growing stream of free cash flow in the future
I understand that Netflix’s free cash flow numbers look horrible at the moment. But Netflix is a subscription business that enjoys a low churn rate. It is also spending plenty of capital to pay upfront for long-lived assets (the original content). I believe that these provide the potential for Netflix to generate high free cash flow in the future, if it continues to grow its subscriber base.
Valuation
“Cheap” is definitely not a good way to describe Netflix’s shares. The company has trailing earnings per share of US$3.12 against a share price north of US$300. That’s a price-to-earnings (PE) ratio of around 100. But Netflix has the tailwinds of expanding margins and revenue growth. The company is currently on track to achieve its goal of an operating margin of 13% in 2019, up from just 4% in 2016. It is targeting an operating margin of 16% in 2020.
Let’s assume that in five years’ time, Netflix can hit 300 million subscribers worldwide paying US$12 per month on average. The lowest-tier plan in the US is currently US$9 per month, and Netflix has managed to grow its average revenue per user at a healthy clip, as shown in the table below.
Source: Netflix earnings
With the assumptions above, Netflix’s revenue in five years would be US$43 billion. If we apply a 20% net profit margin, the company would then earn US$8.6 billion in net profit. With an earnings multiple of just 30, Netflix’s market capitalisation in five years would be US$258 billion, nearly double from the current market capitalisation of US$134 billion. This equates to an annualised return of 14%. I think my assumptions are conservative. Higher subscriber numbers, higher average revenue per user, and fatter margins will lead to much higher upside.
The risks involved
There are three key risks that I see in Netflix.
First, Netflix’s cash burn and weak balance sheet is a big risk. I think Netflix’s strategy to produce original content is sound. But the strategy necessitates the spending of capital upfront, which has led to debt piling up on the balance sheet. I will be watching Netflix’s free cash flow and borrowing terms. For now, Netflix depends on the kindness of the debt markets – that’s a situation the company should be getting itself out of as soon as possible.
Second, there’s competition. Tech giant Apple and entertainment heavyweight Disney recently launched their streaming offerings, and the space is getting more crowded as we speak. As I mentioned earlier, I think Netflix should be able to withstand competition. In fact, I think the real victims will be cable TV companies. This is not a case of Netflix versus other streaming options – this is a case of streaming services versus cable. Different streaming services can co-exist and thrive. And even if the streaming market has a shakeout, Netflix, by virtue of its already massive subscriber base, should be one of the victors. But I can’t know for sure. Only time will tell. Netflix’s subscriber numbers in the future will show us how it’s dealing with competition.
Third, there’s key-man risk. Reed Hastings has been a phenomenal leader at Netflix, but he’s not the only important member of the management team. Ted Sarandos, 54, Netflix’s Chief Content Officer, is also a vital figure. He has been leading Netflix’s content team since 2000, and was a driving force in Netflix’s transition into original content production that started in 2013. If Hastings and/or Sarandos were to leave Netflix for whatever reason, I’ll be concerned.
TheGood Investors’ conclusion
Despite already having more than 158 million subscribers worldwide, Netflix still has a large market opportunity to conquer. The company also has an excellent management team with integrity, and has an attractive subscription business model with sticky customers. Although Netflix’s balance sheet is currently weak and it has trouble generating free cash flow, I think the company will be able to generate strong free cash flow in the future.
There are certainly risks to note, such as a high debt-burden, high cash-burn, and an increasingly competitive landscape. Key-man departures, if they happen, could also significantly dent Netflix’s growth prospects.
But in weighing the risks and rewards, I think the odds are in my favour.
Disclaimer: The Good Investors is the personal investing blog of two simple guys who are passionate about educating Singaporeans about stock market investing. By using this Site, you specifically agree that none of the information provided constitutes financial, investment, or other professional advice. It is only intended to provide education. Speak with a professional before making important decisions about your money, your professional life, or even your personal life.
The price you had initially purchased Sembcorp Marine’s shares at is irrelevant in deciding whether you should hold or sell the shares now.
I participate in Seedly’s community forums by answering investing-related questions. Recently, there was a question along the lines of “What should I do with my Sembcorp Marine shares that are in the red?” I thought my answer is worth sharing with a wider audience. It is reproduced below (with slight tweaks made for readability).
—
Hello! The price you had initially purchased Sembcorp Marine’s shares at is irrelevant in deciding whether you should hold or sell the shares now.
When it comes to any stock, we should constantly be assessing what its future business prospects look like and compare it to the current stock price. At any point in time, if you realise that the current stock price reflects a bright future whereas the actual future business prospects look relatively dimmer to you, then that’s a good time to sell.
I wish I could give you a holistic framework to assess the future prospects of Sembcorp Marine. But I don’t have one. Right now, the company’s revenue depends heavily on the level of oil prices. I don’t have any skill in determining how a commodity’s price will move in the future, so I’ve largely stayed away from stocks whose revenues rely on commodity prices.
When you make your decision about what to do with your Sembcorp Marine shares, you’ll have to make a judgement on how the company’s business will fare five to 10 years from now. This judgement will in turn depend on your views on how the price of oil changes in that timeframe.
There’s another wrinkle to the equation. Sometimes a stock’s price can still fall even when there’s a positive macro-economic change. In the case of the oil & gas industry, a company’s stock price could still decline despite rising oil prices, if said company’s balance sheet is very weak and it has significant trouble in generating positive free cash flow.
Right now (as of 30 September 2019), Sembcorp Marine’s balance sheet holds S$468 million in cash, but S$4.15 billion in total debt. These numbers give rise to net-debt (total debt minus cash) of S$3.68 billion, which is significantly higher than the company’s shareholders’ equity of $2.25 billion. In fact, the net-debt to shareholders’ equity ratio of 164% is uncomfortably high in my view.
If I look at data from S&P Global Market Intelligence, Sembcorp Marine’s free cash flow has also been negative in every year from 2014 to 2018, with the exception of 2016. There has been no improvement detected so far in 2019. The first nine months of this year saw the company produce negative operating cash flow and free cash flow of S$17 million and S$290 million, respectively.
A weak balance sheet and inability to generate free cash flow could be a toxic combination for a company. That’s because the company’s lenders may be concerned with the situation and demand even tougher borrowing terms in the future. This starts a vicious cycle of pricier debt leading to an even weaker ability to service and repay borrowings, resulting in even pricier debt.
Sembcorp Marine is fortunate because it has the backing of Sembcorp Industries (Sembcorp Industries owns the majority of Sembcorp Marine’s shares), which has the relatively more stable utilities business to act as a buffer. It’s worth noting too that Temasek Holdings, one of our local government’s investment arms, is a major shareholder of Sembcorp Industries. But it’s anybody’s guess as to how much support Sembcorp Industries is ultimately willing to provide Sembcorp Marine.
I hope what I’ve shared can give you useful context in making a decision with your Sembcorp Marine shares.
Disclaimer: The Good Investors is the personal investing blog of two simple guys who are passionate about educating Singaporeans about stock market investing. By using this Site, you specifically agree that none of the information provided constitutes financial, investment, or other professional advice. It is only intended to provide education. Speak with a professional before making important decisions about your money, your professional life, or even your personal life.
Factor-based investing is an approach that involves investing in stocks that exhibit a few or just one particular characteristic.
These characteristics could be value, quality, or size “factors” to name a few. For example, an investment approach based on the value factor will involve investing in stocks that trade at a relative discount to their peers, be it on a low price-to-earnings (PE) or price-to-book (PB) ratio.
Does factor-investing work?
The idea behind factor-based investing is that the factors that shape the investing approach should be highly correlated with positive investment returns. For instance, back-testing has shown that stocks that exhibit a low PE ratio have over the long-run outperformed the broader market.
Therefore, exposing your portfolio to stocks that exhibit these characteristics will, in theory, reward you over time.
Sieving the wheat from the chaff
But not all factor-based investing works. Choosing the right factor to invest in plays a huge part in your success.
Andrew Ang, BlackRock’s head of Factor Investing Strategies, explained in a recent article that investors need to be able to distinguish between factors that are simply “passing fads” and those that are “fundamentally-based.” He explained two criteria he uses to make the distinction:
Economic rationale
The factor should have an economic rationale for its return premium. In the world of Big data, it is easy to find coincidental correlations between a factor and returns. However, many of these correlations are due to chance.
By focusing on factors that have economic rationale which drives their outperformance, we can be certain that there is a legitimate and very real reason behind the correlation between performance and the factor.
Decades of data
For the retail investor, it is difficult to gather enough information to backtest a particular factor over decades or even longer. However, funds with access to big data, are able to use the information to see if a factor has a long-term correlation with performance.
Using factor-based investing
If you are thinking of using a factor-based approach for your investment portfolio, there are a few things to take note of.
First, define your investment goal and identify factors that can help you achieve your goals.
Second, not all stocks that exhibit a particular factor will produce similar returns. The correlation between factors and returns is based on a large amount of data comprising thousands of companies. As such, your portfolio needs to be heavily diversified in many companies that exhibit that factor.
Combining factors into a solid investing framework
There is good evidence that factor-based investing has worked well in the past.
However, investors need to identify the factors that are the most correlated with positive returns. It may also be useful to combine certain “style” factors together into a more robust investment framework. An investment framework can help you focus your portfolio on stocks that are even more likely to do well over the long-term.
Disclaimer: The Good Investors is the personal investing blog of two simple guys who are passionate about educating Singaporeans about stock market investing. By using this Site, you specifically agree that none of the information provided constitutes financial, investment, or other professional advice. It is only intended to provide education. Speak with a professional before making important decisions about your money, your professional life, or even your personal life.
Investors are fearful of Mapletree North Asia Commercial Trust right now. Should we buy its shares? The answer is surprisingly complicated.
Yesterday, a wise and kind lady whom Jeremy and I know asked us: “Buying when there is blood on the street is a golden rule in investing. So should I buy Mapletree North Asia Commercial Trust now?”
I responded to her query, and I thought my answer is worth sharing with a wider audience. But first, we need a brief introduction of the stock in question.
The background
Mapletree North Asia Commercial Trust is a REIT (real estate investment trust) that is listed in Singapore’s stock market. It currently has a S$7.7 billion portfolio that holds nine properties across Beijing, Shanghai, Hong Kong, and Japan.
Festival Walk is a retail mall and is the REIT’s only property in Hong Kong. It also happens to be Mapletree North Asia Commercial Trust’s most important property. In the first half of FY19/20 (the fiscal year ending 31 March 2020), Festival Walk accounted for 62% of the REIT’s total net property income.
Hong Kong has been plagued by political and social unrest for months. On 12 November 2019, protestors in the special administrative region caused extensive damage to Festival Walk. Mapletree North Asia Commercial Trust’s share price (technically a unit price, but let’s not split hairs here!) promptly fell 4.9% to S$1.16 the day after. At S$1.16, the REIT’s share price had fallen by nearly 20% from this year’s peak of S$1.43 (after adjusting for dividends) that was reached in July.
For context on Mapletree North Asia Commercial Trust’s sliding share price over the past few months, consider two things.
First, the other REITs under the Mapletree umbrella have seen their share prices rise since Mapletree North Asia Commercial Trust’s share price peaked in July this year – the share prices of Mapletree Industrial Trust, Mapletree Logistics Trust, and Mapletree Commercial Trust have risen by 13%, 5%, and 12%, respectively (all after adjusting for dividends). Second, Mapletree North Asia Commercial Trust’s results for the second quarter of FY19/20 was released on 25 October 2019 and it was decent. Net property income was up 1.3% from a year ago while distribution per unit inched up by 0.6%. And yet, the share price has been falling.
To me, it seems obvious that fears over the unrest in Hong Kong have affected investors’ sentiment towards the REIT.
The response
My answer to the lady’s question is given in whole below (it’s lightly edited for readability, since the original message was sent as a text):
“Buying decisions should always be made in the context of a portfolio. Will a portfolio that already has 50% of its capital invested in stocks that are directly linked to Hong Kong’s economy (not just stocks listed in Hong Kong) need Mapletree North Asia Commercial Trust? I’m not sure. But in a portfolio that has very light exposure to Hong Kong, the picture changes.
Mapletree, as a group, has run all its REITs really well. But most of the public-listed REITs are well-diversified in terms of property-count or geography, or both. Mapletree North Asia Commercial Trust at its listing, and even today, is quite different – it’s very concentrated in geography and property-count. But still, the properties seem to be of high quality, so that’s good.
Buying when there’s blood on the streets makes a lot of sense. But statistics also show that of all stocks ever listed in the US from 1980 to 2014, 40% have fallen by at least 70% from their peak and never recovered. So buying when there’s blood on the streets needs a caveat: That the stock itself is not overvalued, and that the business itself still has a bright future.
Mapletree North Asia Commercial Trust’s valuation looks good, but its future will have to depend on the stability of Hong Kong 5-10 years from now. I’m optimistic about the situation in Hong Kong while recognising the short-term pain. At the same time, I won’t claim to be an expert in international relations or the socio-economic fabric of Hong Kong. So, diversification at the portfolio level will be important.
With all this being said, I think Mapletree North Asia Commercial Trust is interesting with a 2% to 3% weighting in a portfolio that does not already have a high concentration (say 20%?) of companies that do business in Hong Kong.”
Perspectives
I mentioned earlier that Mapletree North Asia Commercial Trust’s valuation looks good and that it owns high-quality properties.
The chart below shows the REIT’s dividend yield and price-to-book (PB) ratio over the last five years. Right now, the PB ratio is near a five-year low, while the dividend yield – which is nearly 7% – looks favourable compared to history.
Source: S&P Capital IQ
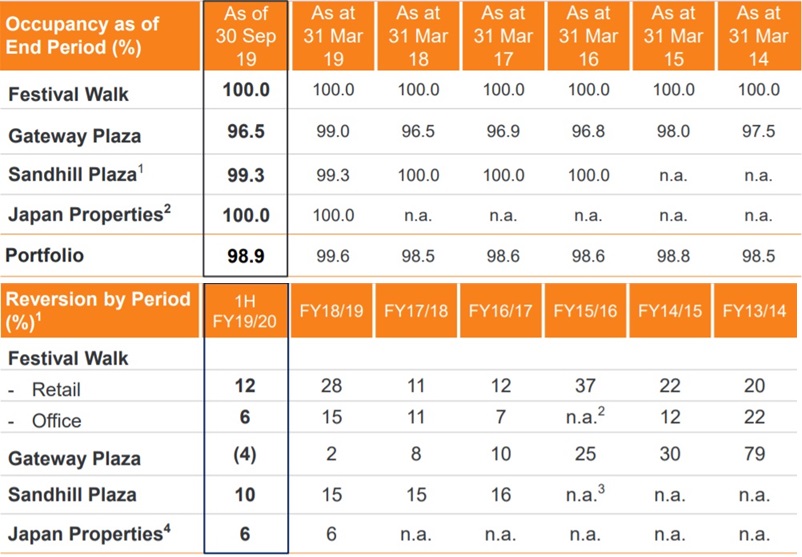
On the quality of the REIT’s property portfolio, there are two key points to make: First, the portfolio has commanded a high occupancy rate of not less than 98.5% in each of the last six fiscal years; second, the properties in the portfolio have achieved healthy rental reversion rates over the same period.
Source: Mapletree North Asia Commercial Trust earnings presentation
Growth in gross revenue, net property income, and distribution per unit – The REIT’s net property income has grown in each year from FY14/15 to FY18/19, and has increased by 9.4% per year. Distribution per unit also climbed in each year for the same period, and was up by 4.1% annually.
Low leverage and a strong ability to service interest payments on debt – The REIT has a high leverage ratio. As of 30 September 2019, the leverage ratio is 37.1%, which is only a small distance from the regulatory leverage ratio ceiling of 45%. But its interest cover ratio for the quarter ended 30 September 2019 is 4.2, which is fairly safe.
Favourable lease structures and/or a long track record of growing rent on a per-area basis – At the end of FY18/19, nearly all of Festival Walk’s leases included step-up clauses in base rent. Small portions of the respective leases for the other properties in the REIT’s portfolio also contain step-up clauses. In addition, the REIT has been able to produce strong rental reversions over a multi-year period, as mentioned earlier.
Conclusion
Mapletree North Asia Commercial Trust currently has an attractive valuation in relation to history. It’s also cheaper than many other REITs in Singapore – for example, its sister REITs under the Mapletree group have dividend yields ranging from only 4% to 5%. It also has other attractive traits, such as a strong history of growth, a safe interest cover ratio, and favourable lease structures.
On the other hand, Mapletree North Asia Commercial Trust has high concentration risk since Festival Walk accounts for more than half its revenue. Moreover, Festival Walk’s prospects depend heavily on the stability of Hong Kong’s sociopolitical fabric. I don’t think anyone can be certain about Hong Kong’s future given the current unrest (which seems to have escalated in recent weeks). These increase the risk profile for the REIT in my view.
To balance both sides of the equation on Mapletree North Asia Commercial Trust, I think my point on portfolio-level diversification given in my answer to the lady’s question is critical.
I’m often asked if a certain stock is a good or bad buy. The question is deceptively difficult to answer because it depends on your risk appetite and your investment portfolio’s composition. A stock that makes sense for one portfolio may not make sense for another. Keep this in mind when you’re assessing whether Mapletree North Asia Commercial Trust is suitable for your portfolio.
Disclaimer: The Good Investors is the personal investing blog of two simple guys who are passionate about educating Singaporeans about stock market investing. By using this Site, you specifically agree that none of the information provided constitutes financial, investment, or other professional advice. It is only intended to provide education. Speak with a professional before making important decisions about your money, your professional life, or even your personal life.
These 3 portfolio management strategies can help you better manage the risk-reward profile of your investment portfolio.
Portfolio management is an important skill in investing. Take on too much risk and you may be left with sizeable losses. Take on too little risk and your returns will be mediocre.
So how do we balance risk and returns?
Given the uncertainty surrounding the market today, I thought it would be an opportune time to share some portfolio management tips that I believe investors can adopt.
Mind the size
Whatever you invest in, it is important to invest an amount that you are comfortable with.
Of course, this can vary depending on the size of your portfolio, your investment strategy, investment horizon, and even your risk appetite.
For stock investors, I encourage you to invest no more than 5% of your entire portfolio capital in a single stock. This reduces the risk that a sudden drop in price in the stock will have a detrimental impact on your returns.
It is not uncommon to find stocks fall more than 30% and never recover. Sometimes it may not be the fault of the investor. Unforeseen circumstances can cause a sudden and irrecoverable disruption to a company’s previously sound business.
We can avoid potentially painful losses when we sufficiently diversify our investments.
Manage the risk
Adding to the first point, it is important to assess the risk-reward profile of a particular investment. For an investment such as a high-growth stock that has a high-risk but high-return possibility, it may be wise to size down your investment to reduce the chance that a permanent fall in the price of the stock will cause a large loss to your portfolio.
Keep cash in hand
Although not all portfolio managers may agree, I prefer to keep some cash in hand. The cash will come in handy when a bargain suddenly appears in the market.
To ensure that I have the means to take advantage of an investment opportunity, I hold 5% of my total investment capital as cash.
There are, however, exceptions to this rule. If stocks have seen a market-wide decline, presenting plenty of investment opportunities, it may be wise to be fully invested to make the most of these bargains.
Portfolio Management Simplified
Obviously there is no one-size-fits-all strategy to invest well. Investors need some investing experience to personalise their own portfolio management according to their goals and needs. However, these three strategies can act as a framework for how to manage an investment portfolio.
Disclaimer: The Good Investors is the personal investing blog of two simple guys who are passionate about educating Singaporeans about stock market investing. By using this Site, you specifically agree that none of the information provided constitutes financial, investment, or other professional advice. It is only intended to provide education. Speak with a professional before making important decisions about your money, your professional life, or even your personal life.
Here are 5 essential characteristics you want your REITs to have.
Investing in Real Estate Investment Trusts (REITs) can be hugely rewarding. Besides providing investors with exposure to a variety of real estate, REITs also enjoy tax benefits and pay out regular and stable dividends (technically REIT dividends are called distributions but let’s not split hairs here) each year.
But as with any asset class, not all REITs will perform equally. Investors need to be able to sieve the wheat from the chaff. With that said, here are five things to look out for that can help you choose the best REITs to invest in.
1. A strong existing portfolio
Investors should look for a REIT that has a good line-up of properties in its portfolio. As a guide, here are some qualities to look out for:
A diversified portfolio of properties, which ideally includes both Singapore and off-shore assets
Properties that have a long or free-hold land lease
Highly sought after sites that could appreciate in value over time
Properties that are located near to public transport or residential hubs (in the case for retail REITs)
Characteristics that suggests tenants are willing to continue renting the space such as a high tenant retention rate, history of positive rental reversions and a high occupancy rate
2. Capable and honest management
Managing a portfolio of properties is no easy task. Managers of the REIT need to maintain a good working relationship with tenants, upkeep the property and carry out strategic asset enhancements to keep the property desirable.
On top of that, managers also have to sell underperforming assets and recycle the proceeds into investments that can grow over time. REIT managers need to make use of low-interest rate environments to grow the portfolio, whilst maintaining a safe capital structure.
With that said, here are some qualities to look for:
A long track record of stable returns for unitholders
A track record of good capital-allocation decisions
A low frequency of private placement (sale of equity only to privileged investors) equity fundraising that dilutes minority unitholders
3. A safe capital structure that can be optimised further
Ideally, investors should look for REITs that still have room to grow in the future. One way that a REIT can grow is to take on more debt in the future to buy assets that can increase its dividend per unit.
In Singapore, REITs need to maintain a capital structure that has not more than 45% debt and 55% equity. Investors should look for REITs that have debt levels well below this regulatory ceiling. While there is no hard and fast rule here, I prefer REITs that have a debt-to-asset ratio of not more than 35%.
The interest expense should also be manageable. REITs will usually provide investors with a snapshot of how much interest they have to pay relative to their earnings. This is called the interest coverage ratio. The higher the interest coverage ratio the better as it suggests the REIT earns more than enough to cover interest payments.
4. A good an honest sponsor
The REIT sponsor is usually also one of its major shareholders. It is responsible for providing the REIT with a pipeline of properties and may also have a stake in the REIT managers.
With such a big say in how the REIT is run and the possibilities of conflict of interest, it is therefore absolutely vital that you trust that the sponsor will treat minority shareholders responsibly.
To determine if a REIT has a good sponsor, investors need to look at the sponsor’s track record in both sponsoring and managing REITs.
Mapletree Investments Pte Ltd in Singapore is one example of a good sponsor that has treated minority shareholders responsibly in the past.
5. A decent valuation
Last but certainly not least is a decent valuation. While some investors prescribe the use of the price-to-book ratio to determine value, I prefer the dividend yield. REITs are a buy-and-hold vehicle and usually do not rapidly recycle their assets. As such, REITs may trade below or above their book values for extended periods of time. For instance, REITs that own properties located in Hong Kong tend to trade at a discount to book value because of the relatively low rental yield of properties in Hong Kong.
On the other hand, the distribution yield gives investors a much clearer idea of how much returns they can actually expect to make.
An investment return in a REIT is the addition of the current yield plus any capital appreciation. As such, investors should look for REITs that have high yields rather than low book values.
The Final Takeaway
Of course, REITs that displays the first four characteristics listed above will likely not sport the highest yields in the market. Investors need to determine for themselves what’s a good price to pay for a REIT that exhibits these favourable characteristics. From experience, if a REIT fits all the characteristics above but trades at a slight premium to the market (ie lower distribution yields compared to the other REITs), they still tend to do much better than their peers over time.
Disclaimer: The Good Investors is the personal investing blog of two simple guys who are passionate about educating Singaporeans about stock market investing. By using this Site, you specifically agree that none of the information provided constitutes financial, investment, or other professional advice. It is only intended to provide education. Speak with a professional before making important decisions about your money, your professional life, or even your personal life.
Here are a few tricks on how to pick the best REITs for your portfolio.
Real estate investment trusts (REITs) are often seen as a reliable source of income for investors.
But that does not mean that you should simply go buy the REIT with the highest yield.
There is a problem with choosing REITs purely based on how cheap they are. That’s because a cheap REIT may be facing problems that could lead to them producing much lower dividends in the future.
Cheap for a reason
For example, let’s assume you bought Sabana Shariah Compliant REIT five years ago.
Back then, Sabana Shariah REIT had a dividend yield of around 7.5% and was paying out a dividend of S$0.0774 per share. By all accounts, that is a handsome yield to have.
ButHowever, today, Sabana Shariah REIT’s dividend is just S$0.0286 per share. Your dividend yield, based on the price you initially paid for the REIT and the dividend today, would be just 2.8%.
Now, let’s assume you had bought Mapletree Commercial Trust five years ago instead, at a dividend yield of 5.5%. That’s lower than what Sabana Shariah REIT offered.
Mapletree Commercial Trust’s dividend five years ago was also S$0.0774 per share. But today, its dividend has grown to S$0.0927 per share. Your dividend yield, based on the price you initially paid for Mapletree Commercial Trust and the dividend today, would be 6.6%.
REITs that Can Feed You For Life
When choosing REITs to invest in, never look at just how high their dividend yields cheap they are. There are many other factors to consider.
As background, I helped to develop the investment framework for a prior Singapore-REIT-focused investment newsletter with The Motley Fool Singapore during my tenure with the company.
The newsletter has delivered good investment returns, so I thought I can offer some useful food-for-thought here. The REIT newsletter was launched in March 2018 and offered 8 REIT recommendations.
As of 15 October 2019, the 8 REITs’ have generated an average return (including dividends) since the newsletter’s inception of 28.8%. In comparison, the Straits Times Index’s return (including dividends) was -3.1% over the same time period. The average return (including dividends) as of 15 October 2019 for all other Singapore-listed REITs that I have data on today that was also listed back in March 2018 is 17.52%.
The investment framework we used had four key pillars.
First, we looked out for long track records of growth in gross revenue (essentially rent the REITs collect from their properties), net property income (what’s left from the REITs’ rent after paying expenses related to the upkeep of their properties), and distribution per unit.
A REIT may fuel its growth by issuing new units as currency for property acquisitions and dilute existing unitholders’ stakes. As a result, a REIT may show growth in gross revenue, net property income, and distributable income, but then have a stagnant or declining distribution per unit. We did not want that.
Second, we looked out for REITs with favourable lease structures that feature annual rental growth, or REITs that have demonstrated a long history of increasing their rent on a per-area basis. The purpose of this pillar is to find REITs that have a higher chance of being able to enjoy organic revenue growth.
Third, we looked for REITs with strong finances. In particular, we focused on the gearing ratio (defined as debt divided by assets) and the interest coverage ratio (a measure of a REIT’s ability to meet the interest payments on its debt).
We wanted a low gearing ratio and a high-interest coverage ratio. A low gearing ratio gives a REIT two advantages: (a) the REIT is likelier to last through tough times; and (b) the REIT has room to take on more debt to make property acquisitions for growth.
A REIT with a high-interest coverage ratio means that it can meet the interest payment on its borrowings without difficulty. At the time of the REIT newsletter’s launch, the eight recommended-REITs had an average gearing ratio of 33.7%, which is far below the regulatory gearing ceiling of 45%. The eight recommended-REITs also had an average interest coverage ratio of 6.2 back then.
Fourth, we wanted clear growth prospects to be present. These prospects could be in the form of newly-acquired properties with attractive characteristics or properties that are undergoing redevelopment that have the potential to deliver higher rental income in the future.
Get Smart: REITs Assemble!
It’s important to note that there are more nuances that go into selecting REITs and that not every REIT that can ace the four pillars above will turn out to be winners. In fact, one of the eight recommended REITs actually generated a loss of 17% from the newsletter’s launch to 15 October 2019. The experience of the REIT newsletter shows just how crucial diversification is when it comes to investing, not just in REITs, but in the stock market in general. But at the very least, I hope what I’ve shared can be useful in your quest to invest smartly in REITs.
To sum up, keep an eye on a few factors:
Growth in gross revenue, net property income, and crucially, distribution per unit.
Low leverage and a strong ability to service interest payments on debt.
Favourable lease structures and/or a long track record of growing rent on a per-area basis.
Catalysts for future growth.
Don’t forget to diversify!
Note: An earlier version of this article was published at The Smart Investor, an investing website run by my friends.
Disclaimer: The Good Investors is the personal investing blog of two simple guys who are passionate about educating Singaporeans about stock market investing. By using this Site, you specifically agree that none of the information provided constitutes financial, investment, or other professional advice. It is only intended to provide education. Speak with a professional before making important decisions about your money, your professional life, or even your personal life.
Being flexible is one of the reasons why I outperformed the market.
At the end of October 2019, I left The Motley Fool Singapore after nearly seven joyful years when the company ceased operations.
In May 2016, The Motley Fool Singapore launched its flagship investment newsletter, Stock Advisor Gold. I’m proud to say that as of 31 October 2019, Stock Advisor Gold had produced a return of 30.6% since the introduction of its first-ever recommendation on 20 May 2016. In comparison, the service’s benchmark, the S&P Global Broad Market Index – a measure for global stocks – had produced a gain of just 16.4% in the same period.
My ex-colleagues in Fool SG’s investing team and I essentially doubled the global stock market in around 3.5 years. I was there every step of the way, leading investing discussions, finding opportunities, dissecting the ideas, maintaining coverage on active recommendations, and more. Here’s how we did it.
The product
A description of Stock Advisor Gold helps set the stage for discussing the winning investing process.
Stock Advisor Gold gave one Singapore stock recommendation and one International stock recommendation every single month. It did so since its inception, come rain or shine. In all, we made 82 recommendations in Stock Advisor Gold.
The 30.6% return mentioned earlier is the simple average of the returns of all the recommended stocks in Stock Advisor Gold, and it includes dividends. Each time we make a recommendation, we also track the performance of the S&P Global BMI (again including dividends) – so the 16.4% performance number refers to the average return someone could theoretically earn if she bought the S&P Global BMI each time Stock Advisor Gold recommended a stock instead of buying the recommended pick.
Stock Advisor Gold’s recommendations typically had an investment time horizon of three years or longer. We were long-term investors.
3 lessons from our investment process
I see three key factors that contributed to our success.
#1 Flexibility
We were flexible in our investment thinking. I believe that investment consultants who try to style-box Stock Advisor Gold will be flummoxed. We had all kinds of stock recommendations in the service.
There was a special-situation: We judged that a transport operator had transformed from a capital-intensive business with no ability to match revenue with its costs into a capital-light cash-flow generating business that is now able to earn contracted revenues that are effectively on a cost-plus model. We had companies that own properties as their main business that are priced at massive discounts to the true market values of their real estate; and these companies came from both ends of the market-capitalisation spectrum. We had small-cap stocks with low valuations that are riding on the volatile but steadily-climbing growth of the world’s appetite for semiconductors and rubber gloves. We had large-cap stocks with high valuation multiples but solid profits and cash flows that are leading the way on trends with tremendous global growth opportunities, such as robotic surgery, DNA analysis, online travel, and more. We had small-cap Software-as-a-Service stocks that were loss-making and burning cash but that are building tremendously sticky and soon-to-be profitable customer bases.
I see our ability to find investment ideas from so many different corners of the market as a strength because it widened our opportunity-set tremendously. It also allowed us to develop a more expansive worldview, which sharpened our investment thinking.
#2 A focus on what matters
At Stock Advisor Gold, we glanced at macro-economics only occasionally – we had a laser-focus on business fundamentals. It was a company’s long-term business prospects in relation to its current stock price that guided our thinking on whether it was an attractive investment opportunity or not.
Let’s look at Netflix as an example (it was not a recommendation in Stock Advisor Gold). The trade war between the US and China has been and continues to be one of the biggest stories in the financial world. But will the squabbles between the two giant economies really quench the public’s appetite for high-quality video programmes that are available 24/7 for a low monthly fee? Will a trade war dampen Netflix’s desire to constantly improve the quality of its programming and streaming capabilities? I don’t think so. And it’s those two factors that really matter for the prospects of the company’s business.
Besides, the gap between a macroeconomic event and the movement of a company’s stock price can be a mile wide. For example, from 30 September 2005 to 15 September 2015, the per-ounce price of gold in Australia had grown by nearly 10% annually from A$621 to around A$1,550. But an index for Australian gold-mining stocks, the S&P / ASX All Ordinaries Gold Index, lost 4% per year in the same period, falling from 3,372 points to 2,245. In another example, despite stunning 15% annual GDP growth in China from 1992 to 2013, Chinese stocks actually fell by 2% per year; Mexico on the other hand, saw its stock market produce an annual gain of 18%, despite its economy growing at a pedestrian rate of just 2% per year.
#3 Being clear on the limits of our knowledge
We strived to be clear on what we did not know, and invested accordingly. We had no idea how commodity prices will move, so in Stock Advisor Gold, we stayed away from companies that we judged to be heavily dependent on commodity price movements for their revenues. We weren’t sure how interest rates would move, so we did not make any investment decisions that depended heavily on the movement of interest rates in certain directions.
Put another way, we aimed to be crystal clear on the limits of our knowledge, and we made sure we never overstepped the boundary. We had safeguarded ourselves against overconfidence.
Conclusion
In investing, the process is even more important than the results. That’s because results can be affected by luck. A bad break could momentarily cause a good process to produce poor results, but over time, the process will prevail. I’m glad that Stock Advisor Gold achieved excellent results with what I deem to be a sound process. I hope all of you who have read this article are able to take away something useful to improve your own investing process. And if you happen to be an ex-member of Stock Advisor Gold or The Motley Fool Singapore, I thank you for your trust and your continued interest in following my investing thoughts.
Disclaimer: The Good Investors is the personal investing blog of two simple guys who are passionate about educating Singaporeans about stock market investing. By using this Site, you specifically agree that none of the information provided constitutes financial, investment, or other professional advice. It is only intended to provide education. Speak with a professional before making important decisions about your money, your professional life, or even your personal life.
The world of finance is full of wild and interesting facts.
The world of finance and investing is full of wild facts and surprising things that I think investors have to know, because they can help shape our investment behaviours for the better. Here are 24 of them, and their related lessons. This article is a work-in-progress, with additions to be made over time. [Note: The latest additions were made on 11 April 2024]
1. Stocks with fantastic long-term returns can be agonising to own over the short-term.
From 1995 to 2015, the US-listed Monster Beverage topped the charts – its shares produced a total return of 105,000%, turning every $1,000 into more than $1 million. But Monster Beverage’s stock price had also dropped by 50% or more from a peak on four separate occasions.
From 1997 to 2018, the peak-to-trough decline for Amazon in each year ranged from 12.6% to 83.0%, meaning to say that Amazon’s stock price had experienced a double-digit peak-to-trough fall every year. Over the same period, Amazon’s stock price climbed from US$1.96 to US$1,501.97, for an astonishing gain of over 76,000%.
Lesson: Volatility in the stock market is a feature, not a bug.
2. The stock price of a company that deals with commodities can fall hard even if the prices of the related-commodities actually grow.
Gold was worth A$620 per ounce at the end of September 2005. The price of gold climbed by 10% per year for nearly 10 years to reach A$1,550 per ounce on 15 September 2015. An index of gold mining stocks in Australia’s market, the S&P / ASX All Ordinaries Gold Index, fell by 4% per year from 3,372 points to 2,245 in the same timeframe.
In 2015, oil prices started falling off a cliff. The lowest price that WTI Crude reached in 2016 was US$26.61 per barrel, on 11 February. 10 months later on 21 December 2016, the price had doubled to US$53.53. Over the same period, 34 of a collection of 50 Singapore-listed oil & gas companies saw their stock prices fall; the average decline for the 50 companies was 11.9%.
Lesson: The gap between a favourable macroeconomic event and a share’s price movement can be a mile wide.
3. Investors can lose money even if they invest in the best fund.
The decade ended 30 November 2009 saw the US-based CGM Focus Fund climb by 18.2% annually. Sadly, the fund’s investors lost 11% per year over the same period. How?!? CGM Focus Fund’s investors chased performance and bailed at the first whiff of trouble.
Lesson: Timing the market is a fool’s errand.
4. Stock prices are significantly more volatile than the underlying business fundamentals.
Nobel-prize-winning economist Robert Shiller published research in the 1980s that looked at how the US stock market performed from 1871 to 1979. Shiller compared the market’s performance to how it shouldhave rationally performed if investors had hindsight knowledge of how dividends of US stocks changed. The result:
The solid line is the stock market’s actual performance while the dashed line is the rational performance. Although there were violent fluctuations in US stock prices, the fundamentals of American businesses – using dividends as a proxy – was much less volatile.
Lesson: We’ll go crazy if we focus only on stock prices – focus on the underlying business fundamentals instead!
5. John Maynard Keyens was a great economist and professional investor. Interestingly, his early years as a professional investor were dreadful.
Finance professors David Chambers and Elroy Dimson published a paper in 2013 titled John Maynard Keynes, Investment Innovator. It detailed the professional investing career of the late John Maynard Keynes from 1921 to 1946 when he was managing the endowment fund of King’s College at Cambridge University.
Chambers and Dimson described Keynes’ investing style in the early years as “using monetary and economic indicators to market-time his switching between equities, fixed income, and cash.” In other words, Keynes tried to time the market. And he struggled. From August 1922 to August 1929, Keynes’ return lagged the British stock market by a total of 17.2%.
Keynes then decided to switch his investing style. He gave up on trying to time the market and focused on studying businesses. This is how Keynes described his later investing approach:
“As time goes on, I get more and more convinced that the right method in investment is to put fairly large sums into enterprises which one thinks one knows something about and in the management of which one thoroughly believes.”
Chambers and Dimson’s paper provided more flesh on Keynes’ business-focused investing style. Keynes believed in buying investments based on their “intrinsic value” and that he preferred stocks with high dividend yields. An example: Keynes invested in a South African mining company because he held the management team in high-regard and thought the company’s stock was selling at a 30% discount to his estimate of the firm’s break-up value.
So what was Keynes’ overall record? From 1921 to 1946, Keynes beat the British stock market by eight percentage points per year. When he tried to time the market, he failed miserably; when he started investing based on business fundamentals, he gained stunning success.
Lesson: Invest by looking at stocks as pieces of businesses – it’s an easier route to success.
6. Having extreme intelligence does not guarantee success in investing.
The hedge fund Long Term Capital Management (LTCM) was staffed full of PhDs and even had two Nobel Prize winners, Myron Scholes and Robert Merton, in its ranks. Warren Buffett even said that “If you take the 16 of them [in LTCM], they probably have the highest average IQ of any 16 people working together in one business in the country, including Microsoft or whoever you want to name – so incredible is the amount of intellect.” LTCM opened its doors in February 1994. The firm eventually went bust a few years later. One dollar invested in its fund in February 1994 became just 30 cents by September 1998.
In 2009, Andrew Lo, a finance professor at the Massachusetts Institute of Technology, started his own investment fund in the US. 2009 was the year when many major stock markets around the world bottomed after the global financial crisis started a few years earlier. Lo’s fund gained 15% in 2010, but then lost 2.7% in 2011, 7.7% in 2012, and 8.1% in 2013. The fund was shut in 2014. The S&P 500 in the US nearly doubled from the start of 2009 to the end of 2013.
Larry Swedroe’s book, The Quest for Alpha: The Holy Grail of Investing, described the track record of MENSA’s investment club in the US. MENSA’s members have IQs in the top 2% of the global population. In the 15 years ended 2001, the S&P 500 gained over 15% per year, while MENSA’s US investment club returned just 2.5% per year.
Lesson: Warren Buffett once said, “You don’t need to be a rocket scientist. Investing is not a game where the guy with the 160 IQ beats the guy with 130 IQ.” It’s more important to invest with the right investment framework and have control over our emotions than it is to have extreme intelligence.
7. A stunning number of stocks deliver negative returns over their entire lifetimes.
A 2014 study by JP Morgan showed that 40% of all stocks that were part of the Russell 3000 index in the US since 1980 produced negative returns across their entire lifetimes. JP Morgan defined “lifetime” as the “time when the company first exists in public form and reports a stock price, and until its last reported price in 2014 or until the date at which it was merged, acquired or for some other reason delisted.”
Lesson: Given the large number of stocks that deliver losses to investors, implementing a robust investment framework that helps to filter out potential losers can make a big difference to our investing results.
8. Going against the herd can actually cause physical pain.
Psychology researchers Naomi Eisenberger, Matthew Lieberman, and Kipling Williams once conducted an experiment whereby participants played a computer game while their brains were scanned. The participants were told they were playing the game with two other people when in fact the other two were computers. The computers were programmed to exclude the human participant after a period of three-way play. During the periods of exclusion, the brain scans of the human participants showed activity in the anterior cingulated cortex and the insula. These are the exact areas of our brain that are activated by real physical pain.
Investor James Montier recounted the experiment in his bookThe Little Book of Behavioral Investing and wrote: “Doing something different from the crowd is the investment equivalent of seeking out social pain.”
Lesson: Investing is not easy, especially when there’s a need to go against the crowd. Make plans to deal with the difficulties.
9. One of Warren Buffett’s best long-term investments looked like a loser in the first few years.
Buffett started buying shares of the Washington Post company (now known as Graham Holdings Company) in 1973 and spent US$11 million in total. By the end of 2007, Buffett’s Washington Post stake had grown by more than 10,000% and was worth US$1.4 billion. By all accounts, Buffet’s Washington Post investment was a smashing success. But here’s the kicker: The Washington Post’s stock price fell by 20% after Buffett’s investment and stayed at that level for three years.
Lesson: Great investments take time to play out. Be patient!
10. It’s easier to make long-term predictions for the stock market than short-term ones.
Source: Robert Shiller’s data; author’s calculation
The two charts above use data on the S&P 500 from 1871 to 2013. They show the returns of the S&P 500 against its starting valuation for holding periods of 1 year (the chart on the left) and 10 years (the chart on the right). The stock market is a coin-toss with a holding period of 1 year: Cheap stocks can fall just as easily as they rise, and the same goes for expensive stocks. But a different picture emerges when the holding period becomes 10 years: Stocks tend to produce higher returns when they are cheap compared to when they are expensive.
Lesson: Invest with a long time horizon because we can make better predictions and thus increase our chances of success.
11. Simple investment strategies often beat complex ones.
Investment manager Ben Carlson wrote in 2017 that the investment performance of US college endowment funds couldn’t beat a simple strategy of investing in low-cost index funds.
For the 10 years ended June 2016, the US college endowment funds with returns that belonged to the top-decile had average annual returns of 5.4%. Carlson described the investment approach of US college endowment funds as such:
“These funds are invested in venture capital, private equity, infrastructure, private real estate, timber, the best hedge funds money can buy; they have access to the best stock and bond fund managers; they use leverage; they invest in complicated derivatives; they use the biggest and most connected consultants…”
In the same 10-year period, a simple portfolio that Carlson named the Bogle Model (after the late index fund legend John Bogle) produced an annual return of 6.0%. The BogleModel consisted of three, simple, low-cost Vanguard funds: The Total US Stock Market Index Fund (a fund that tracks the US stock market), the Total International Stock Market Index Fund (a fund that tracks stocks outside of the US), and the Total Bond Market Index Fund (a fund that tracks bonds). The Bogle Model held the three funds in weightings of 40%, 20%, and 40%, respectively.
Lesson: Simple investing strategies can be really effective too. Don’t fall for a complex strategy simply because it is complex.
Note: An earlier version of this article was published at The Smart Investor, an investing website run by my friends.
The fact below was added on 5 December 2019
12. Buying and holding beats frequent trading.
Jeremy Siegel is a finance professor from Wharton, University of Pennsylvania and the author of several great books on investing. In 2005, he published a book, The Future For Investors. Wharton interviewed him to discuss the research for the book, and Siegel shared an amazing statistic (emphasis is mine):
“If you bought the original S&P 500 stocks, and held them until today—simple buy and hold, reinvesting dividends—you outpaced the S&P 500 index itself, which adds about 20 new stocks every year and has added almost 1,000 new stocks since its inception in 1957.”
The S&P 500 is not a static index. Many stocks have been added to it while many stocks have also removed. So, we can also see the S&P 500 as a ‘portfolio’ of stocks that have experienced very active buying and selling. What Siegel discovered was that over a period of nearly 50 years, a long-term buy-and-hold ‘portfolio’ of the original S&P 500 stocks would have outperformed the actual S&P 500 index that had seen all that relatively frantic ‘trading’ activity.
Lesson: Active trading is bad for our returns. To do well in investing, patience is an important ingredient.
The facts below were added on 8 January 2020
13. It’s incredibly difficult to make money by trading currencies.
The Autorité des Marchés Financiers (AMF) is the financial regulator in France – think of them as the French version of the Monetary Authority of Singapore. In 2014, the AMF published a study on individual forex traders. It looked at the results of 14,799 individual forex traders for a four-year observation period from 2009 to 2012 and found some astonishing data:
89% of the traders lost money
The average loss was €10,887 per trader
The total loss for the nearly 15,000 traders was more than €161 million
Lesson: Trading currencies could be a faster way to lose money than lighting your cash on fire.
14. Historically, the longer you hold your stocks, the lower your chances of losing money.
Based on data for the US stock market from 1871 to 2012 that was analysed by Morgan Housel, if you hold stocks for two months, you have a 60% chance of making a profit. Stretch the holding period to 1 year, and you have a 68% chance of earning a positive return. Make the holding period 20 years, and there’s a 100% chance of making a gain. The chart below, from Morgan, illustrates these:
15. Huge moves in stocks that should not have happened, according to mainstream finance theories, have happened.
In 12 August 2019, Argentina’s key stock market benchmark, the Merval Index, fell by a stunning 48% in US-dollar terms. That’s a 48% fall. In. One. Day.
According to investor Charlie Bilello, the decline was a “20+- sigma event.” Mainstream finance theories are built on the assumption that price-movements in the financial markets follow a normal distribution. Under this framework, the 48% one-day collapse in the Merval Index should only happen once every 145,300,000,000,000,000,000,000,000,000,000,000,000,000,000,000,000,000,000,000,000,000,000,000,000,000,000,000,000 years.
For perspective, the age of the universe is estimated to be 13.77 billion years, or 13,770,000,000 years.
Lesson: The movement of prices in the financial markets are significantly wilder than what the theories assume. How then can we protect ourselves? Bilello said it best: “We must learn to expect the unexpected and be prepared for multiple outcomes, with diversification serving as our best defense.”
The facts below were added on 31 January 2020
16. Timing the market based on recessions simply does not work.
In an October 2019 blog post, investor Michael Batnick included the following chart:
The red line shows the growth of $1 from 1980 to late 2019 if we bought US stocks at the official end-date of recessions, and sold stocks at the official start-dates. A $1 investment became $31.52, which equates to an annual return of 9.3%. That’s not too shabby.
But if we had simply bought and held US stocks over the same period, our dollar would have grown by 11.8% per year to become $78.31. That’s a significantly higher return.
Lesson: Trying to side-step recessions can end up harming our returns, so it’s far better to stay invested and accept that recessions are par for the course when it comes to investing.
17. The market is seldom average.
Data from Robert Shiller show that the S&P 500 had grown by 6.9% per year (after inflation and including dividends) from 1871 to 2019. But amazingly, in those 148 years, only 28 of those years showed a return of between 0% and 10%. There were in fact 74 years that had a double-digit gain, and 23 years with a double-digit decline.
The chart below shows the frequency of calendar-year returns for the S&P 500 from 1871 to 2019:
Source: Robert Shiller’s data; my calculations
Lesson: Market returns are rarely average, so don’t expect to earn an average return in any given year. Don’t be surprised too and get out of the market even if there has been a big return in a year.
The facts below were added on 11 February 2020
18. An entire country’s stock market can go crazy.
The stock market’s a great place to build wealth over the long run. Data from the Credit Suisse Global Investment Returns Yearbook 2019 report show that developed economy stocks have generated a return of 8.2% per year from 1900 to 2018 – this turns $1,000 into $10.9 million. Meanwhile, stocks from emerging markets have climbed by 7.2% per year from 1900 to 2018, turning $1,000 into $3.7 million.
But there’s also the case of Japan. The country’s main stock market benchmark, the Nikkei 225 Index, hit a peak of nearly 39,000 in December 1989, more than 30 years ago. It sits below 24,000 today, a decline of around 40% from the high point in December 1989.
The reason Japanese stocks have delivered this poor return over such a long period of time is because they had crazy-high valuations. Investor Mebane Faber pointed out in a blog post a few years ago that Japan’s stock market had a CAPE ratio of nearly 100 at the peak. The CAPE ratio – or cyclically-adjusted price-to-earnings ratio – is calculated by dividing a stock’s price with its average inflation-adjusted earnings over the past 10 years.
For context, the US stock market’s highest CAPE ratio since the 1870s was 44, which was reached in December 1999, at the height of the dotcom bubble. From the 1870s to today, the average CAPE ratio for US stocks is just 17.
Lesson: The entire Japanese stock market went crazy in the late 1980s, resulting in a disastrous return for investors even after more than 30 years. The experience of Japan’s stock market is also a great reminder that we should diversify our investments geographically.
19. Some of the best investors in the world don’t know what the stock market will do over the short-term.
What do Peter Lynch, Warren Buffett, and Jim Simmons have in common? They all would easily belong to any “Greatest Investors” list.
Lynch was the manager of the US-focused Fidelity Magellan Fund from 1977 to 1990. During his 13-year tenure, he produced an annual return of 29%, nearly double that of the S&P 500. Meanwhile, Buffett has been in control of his investment conglomerate, Berkshire Hathaway, since 1965. From then to 2018, he grew the book value per share of Berkshire by 18.7% per year by using its capital to invest in stocks and acquire companies. Over the same period, the S&P 500 compounded at merely 9.7% annually. As for Simmons, he runs Renaissance Technologies, an investment firm he founded. Renaissance’s flagship is Medallion Fund, which generated an astonishing annual return of 66% (before fees) and 39% (net of fees) from 1988 to 2018.
There’s another thing that Lynch, Buffett, and Simmons all have in common: They have no clue what the stock market will do over the short-term.
“What the market’s going to do in one or two years, you don’t know. Time is on your side in the stock market. It’s on your side. And when stocks go down, if you’ve got the money, you don’t worry about it and you’re putting more in, you shouldn’t worry about it. You should worry what are stocks going to be 10 years from now, 20 years from now, 30 years from now.”
Buffett wrote a famous op-ed for The New York Times in October 2008, at the height of the Great Financial Crisis. In it, Buffett shared:
“Let me be clear on one point: I can’t predict the short-term movements of the stock market. I haven’t the faintest idea as to whether stocks will be higher or lower a month or a year from now. What is likely, however, is that the market will move higher, perhaps substantially so, well before either sentiment or the economy turns up. So if you wait for the robins, spring will be over.”
There’s an incredible story on Simmons panicking in December 2018, after the US stock market had suffered a steep drawdown. Simmons asked his financial advisor if he should be selling short, literally a day before the US market reached the trough of its decline.
It’s easy for us to think that investing masters like Peter Lynch, Warren Buffett and Jim Simmons will be great at predicting what the stock market is going to do over the short run. But the truth is, they don’t. They have no idea.
Lesson: We can still achieve great long-term investing results even if we have no idea what the market’s going to do over the short run.
The facts below were added on 23 March 2020
20. Recessions and market crashes are inevitable
Economist Hyman Minsky passed away in 1996. When he was alive, his ideas were not well-known. But they gained widespread attention after the Great Financial Crisis of 2007-09.
That’s because Minsky had a framework for understanding why economies go through inevitable boom-bust cycles: Stability itself is the seed of instability. When an economy is stable and growing, people feel safe. This feeling of safety leads to people taking on more risk, such as borrowing heavily. The system in turn becomes fragile.
Minsky’s idea can be applied to stocks too. Let’s assume that stocks are guaranteed to grow by 9% per year. What will this world look like? The only logical result would be that people would keep paying up for stocks, till the point that stocks become way too expensive to return 9% a year. Or people will pile on risk, such as borrowing heavily to buy stocks.
But bad things happen in the real world and they happen often. And when stocks are priced for perfection, bad news will lead to market crashes.
Despite the inevitability of recessions and market crashes, stocks have still done very well over time. Between 1928 and 2013, the S&P 500 had, on average, fallen by 10% once every 11 months; 20% every two years; 30% every decade; and 50% two to three times per century. So stocks have declined regularly. But over the same period, the S&P 500 also climbed by 283,282% in all (including dividends), or 9.8% per year.
21. Volatility clusters – and its important implication
Volatility has been the name of the game for the financial markets in recent times. This is what the S&P 500 in the US has done over the past two weeks:
9 March 2020: -7.6%
10 March 2020: +4.9%
11 March 2020: -4.9%
12 March 2020: -9.5%
13 March 2020: +9.3%
16 March 2020: -12.0%
17 March 2020: +6.0%
18 March 2020: -5.2%
19 March 2020: +0.5%
20 March 2020: -4.3%
We can see that really good days are mixed together with really bad days. This clustering of volatility is actually common. Investor Ben Carlson produced the table below recently (before March 2020) which illustrates the phenomenon.
The clustering means that it’s practically impossible to side-step the bad days in stocks and capture only the good days. This is important information for us, because missing just a handful of the market’s best days will destroy our returns.
Fund manager, Dimensional Fund Advisors, which manages more than US$600 billion, shared the following stats in a recent article:
$1,000 invested in US stocks in 1970 would become $138,908 by August 2019
Miss just the 25 best days in the market, and the $1,000 would grow to just $32,763
Lesson: It is important that we stay invested. But this does not mean we should stay invested blindly. Companies that currently are heavily in debt, and/or have shaky cash flows and weak revenue streams are at much higher risk of running into severe problems, whether the economy is healthy or in trouble. It’s good practice to constantly evaluate the companies in our portfolios.
The facts below were added on 17 October 2022
22. Rising interest rates have been met with rising valuations
There’s plenty of attention being paid to interest rates because of its theoretical link with stock prices. Stocks and other asset classes (bonds, cash, real estate etc.) are constantly competing for capital. In theory, when interest rates are high, the valuation of stocks should be low, since bonds, being an alternative to stocks, are providing a good return. On the other hand, when interest rates are low, the valuation of stocks should be high, since the alternative – again, bonds – are providing a poor return.
But the real relationship between interest rates and stock market valuations is nowhere near as clean as what’s described in theory. Yale economist Robert Shiller, who won a Nobel Prize in 2013, has a database on interest rates and stock market prices, earnings, and valuations going back to the 1870s. According to his data, the US 10-year Treasury yield was 2.3% at the start of 1950. By September 1981, it had risen to 15.3%, the highest rate recorded in Shiller’s dataset. In that same period, the S&P 500’s price-to-earnings (P/E) ratio moved from 7 to… 8. That’s right, the P/E ratio for the S&P 500, a broad-based US stock market index, increased slightly despite the huge jump in interest rates.
(It’s worth noting too that the S&P 500’s P/E ratio of 7 at the start of 1950 was not a result of earnings that weretemporarily inflated.)
Yes, I’m cherry picking with the dates for the second point. For example, if I had chosen January 1946 as the starting point, when the US 10-year Treasury yield was 2.2% and the P/E ratio for the S&P 500 was 19, then the theoretical relationship between interest rates and stock market valuations would appear to hold up nicely.
Lesson: Interest rates have a role to play in the movement of stocks, but it is far from the only thing that matters. Moreover, one-factor analysis in finance – “if A happens, then B will occur” – should be largely avoided because clear-cut relationships are rarely seen.
23. Peak valuations for stocks don’t happen at the lowest interest rates
In Point 22 above, I mentioned that “the real relationship between interest rates and stock market valuations is nowhere near as clean as what’s described in theory [where the theory is that rising rates will lead to falling valuations].” The chart below, which I first saw from a Twitter user with the handle @modestproposal, is a great example.
It illustrates the relationship that the S&P 500’s price-to-earnings (P/E) ratio has with 10-year bond yields in the USA. Interestingly, the S&P 500’s P/E ratio has historically and – noticeably – peaked when the 10-year bond yield was around 5%, and not when the 10-year bond yield was materially lower at say 3% or 2%.
Lesson: Don’t assume that peak valuations for stocks must happen at the lowest interest rates.
The fact below was added on 11 April 2024
24. Buying stocks at all-time highs leads to higher returns than buying stocks at random timings
Intuitively, it makes sense that investing in stocks when they are at all-time highs should lead to poorer returns than if you were to invest in stocks at any random day. But history suggests otherwise. According to Ritholtz Wealth Management (link leads to a video; watch from 38:00 mark), the average annualised return for the S&P 500 since 1970 for someone investing at all-time highs has been 9.43% for one year, 10.53% for three years, and 9.63% for five years. Meanwhile, the average annualised return for the self-same periods for someone investing at any day would be 9.13%, 8.85%, and 8.93%, respectively. These are shown in the chart below:
Source: Ritholtz Wealth Management’s The CompoundYoutube channel
Lesson: Do not stay away from stocks just because they are at all-time highs – time in the market is way more important than timing the market
Disclaimer: The Good Investors is the personal investing blog of two simple guys who are passionate about educating Singaporeans about stock market investing. By using this Site, you specifically agree that none of the information provided constitutes financial, investment, or other professional advice. It is only intended to provide education. Speak with a professional before making important decisions about your money, your professional life, or even your personal life.